Hello there, this is tradingpedia.com and this video deals with another concept related to the Elliott Waves Theory. We move on to the flat patterns, and a flat is a corrective pattern labeled with letters: a-b-c.
The b-wave
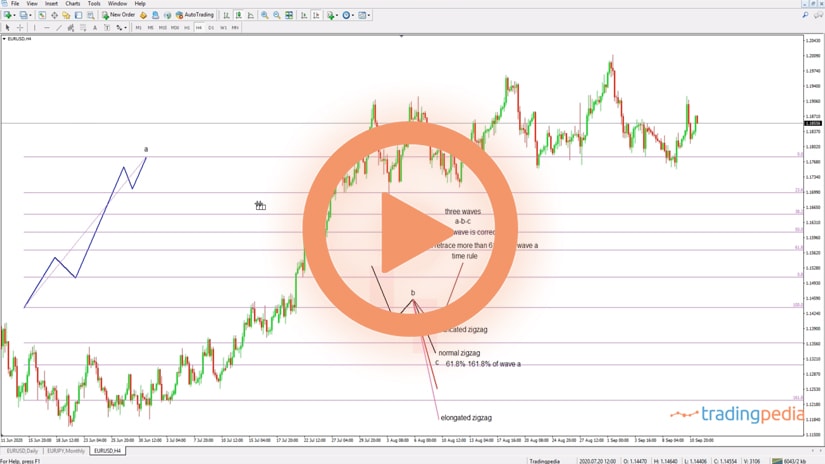
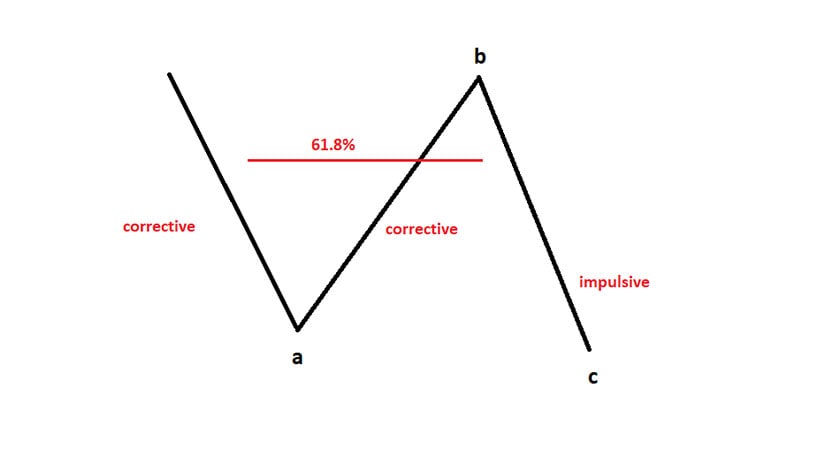
 The key to interpreting the flat pattern is the b-wave. Namely, it must retrace more than 61.8% of wave a. Also, another thing to consider is that both waves a and b are corrective, while only the c-wave is impulsive.
In other words, of a lower degree, waves a and b may form a simple or a complex correction, and the c-wave must be an impulsive wave, 1-2-3-4-5.
A flat pattern looks like this in a bearish trend. The market makes a correction, labeled as wave a. Only by the fact that we use a letter, we assume a corrective structure.
Because the key stays with the b-wave, it must retrace beyond 61.8% of wave a. So, the next market segment must exceed or retrace the level, for the market to form a flat. Therefore, this is the end of the b-wave. And then the market forms an impulsive wave in the opposite direction, and this is how a flat pattern looks like.
This is one type of a flat pattern, but there are no less than ten types of flat patterns. The idea is to identify correctly the b-wave as it holds the secret in interpreting a flat pattern.
Type of Flats
 Literally, there are three categories to consider, depending where the b-wave ends. For this, we need to find out the 61.8% level. The next level is 100% and then 123.6%. Also, let’s write here that depending on the b-wave ends, we have a different category of flats.
Why is this important? Depending on the type of the flat we can interpret the market. According to the Elliott Waves Theory, various types of flats signal different things. If we know the category, we can find the type and have an idea regarding what comes next according to the Elliott Waves Theory.
For instance, if the b-wave retraces between 61.8%-80%, the market forms a weak B-wave. Every time when it ends here, the market forms a weak b-wave. Next, depending on the length of the c-wave we have different types of flats. We won’t mention them in this video but proceeds with the ones in the first category.
The b-wave can also retrace between 80%-100%, and these are normal b-waves. Also, a retracement between 100%-123.6% leads to another category – flats with a strong b-wave. Finally, it can go all the way to beyond 161.8%.
Related Videos
An Example
 As you can see, wave a has no influence, the c-wave gives the type of the flat, but everything is subject to the interpretation of the b-wave’s length.
Let’s that this EURUSD at 1.1917, the previous high. The market moved lower and this segment does not look like an impulsive wave for the simple reason that it is split in equal parts, meaning that there is no extension. We might consider that this is wave a of a flat.
Next, we find out the 61.8% level. We may say that this is the b-wave that retraced between 80%-100%, meaning that the 61.8% minimum condition was reached. Now the market starts the c-wave.
If we know the end of the b-wave, this is called a flat with a normal b-wave and the c-wave tells us the type of the flat and we interpret the next move.
Stay tuned for the second part as we describe the three flat patterns that come into the category of flats with a weak b-wave. Bye, bye.
Three-Wave Structures
 One of the first things to remember about flat patterns is that they are three-wave structures. In the words of Elliott, a three-wave structure is a corrective pattern.
However, we should not take the wording literally. Indeed, flat patterns do have only three segments, so the term applies here. But triangles, for example, have five segments. Yet, Elliott traders refer to them as three-wave structure only to point out the fact that they are corrective patterns.
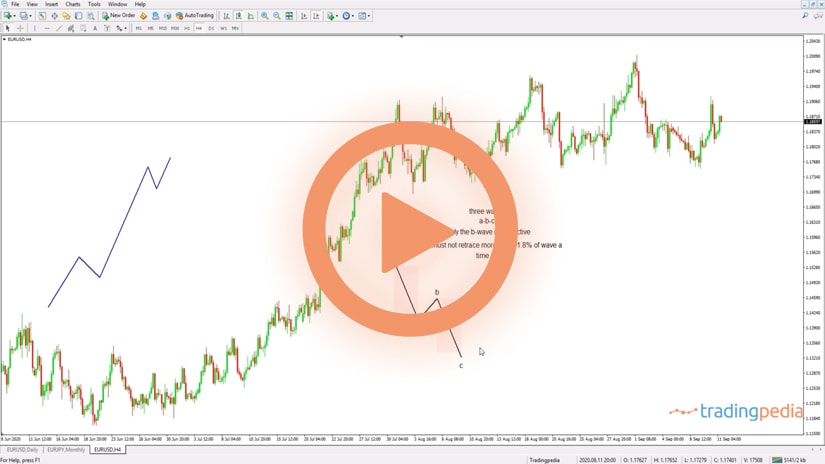
A flat, therefore, is a corrective pattern. Any corrective patterns is labeled with letters. Therefore, a three-wave structure labeled with letters must be counted as a-b-c.
But here comes the trick. While the entire pattern, the flat, is corrective, not all of its segments are. Out of the three waves, only waves a and b are corrective, while wave c is impulsive. Put it differently, a flat pattern is a corrective pattern within the Elliott Waves Theory that has an impulsive structure as the c-wave.
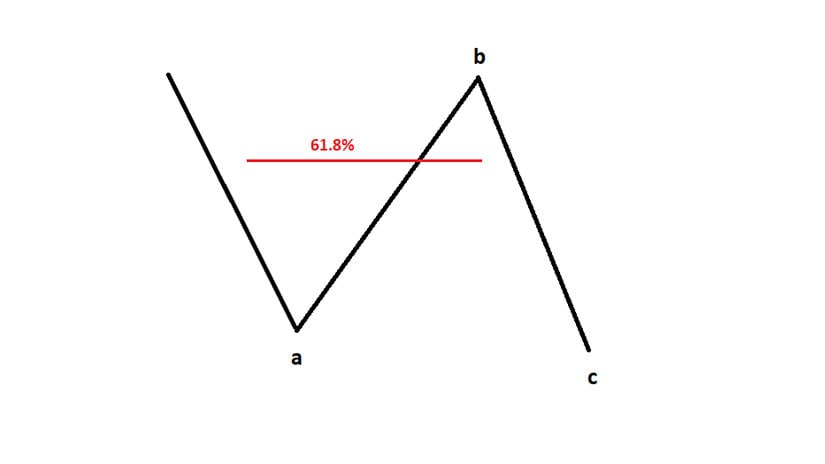
A simple illustration of a flat pattern would look like above. The red line marks the 61.8% retracement of wave a. Without such retracement, we cannot talk about a flat pattern. It is mandatory for the price action that follows after wave a is completed, that the b-wave retraces at least 61.8% of wave a’s distance.
If we are to set one most important rule in interpreting a flat pattern, this is it: the b-wave must retrace more than 61.8% into wave a’s territory. What follows after helps the Elliott trader interpreting the type of flat, because the length of the b-wave is decisive in finding out the type of the flat pattern.
Breaking Down the Flat Pattern
 A flat pattern is, therefore, a corrective structure with waves a and b corrective, and wave c impulsive. Let’s take them separately and discuss what structures one can expect within the flat pattern.
Wave a is corrective. The Elliott Waves Theory tells us that there are two types of corrective waves – simple and complex. Both a simple or a complex correction might form as the wave a of a flat pattern.

However, some limitations do exist. For example, simple corrections within the Elliott Waves Theory are flats, zigzags, and triangle. But a triangle cannot appear as the wave a of a flat. Therefore, if the wave a of a flat is a simple correction, it can either be a flat of a lower degree, or a zigzag of a lower degree.
On the other hand, if the wave a of a flat is a complex correction, it means that it will have at least one, and maximum two, intervening waves. An intervening wave is called the x-wave, and its “job” is to connect the simple corrective waves part of the complex structure. Typically, the wave a of a flat is either a double combination of a lower degree, or a simple flat or zigzag pattern.
Everything said about wave a of a flat is valid for wave b as well, which leaves us with wave c – the impulsive wave.
Two types of impulsive waves exist, according to the Elliott Waves Theory – classic and terminal. While labeled with numbers, the only difference between the two is that in a terminal impulsive wave all segments are corrective.
Interpreting the B-Wave Is Key
The length of the b-wave tells us the category of the flat pattern, while the length of the c-wave tells us the type of the flat.
Three categories of flat patterns exist:
- Weak B-wave
- Normal B-wave
- Strong B-wave
In the first category, we must include only the flat patterns that have the wave b retracing between 61.8% and 80% of wave a’s length. In the second category, we can include those flats that have the wave b retracing between 81% and 100% of wave a. Finally, in the third category, we have the flats that have a wave b that is so strong that it exceeds 100% retracement of the previous wave a.
In each of these categories, we can include three types of flats, based on the length of the c-wave.
Weak B-Wave
In this category, we have:
- Flat with a b-failures
- Flat with a double failure
- Elongated flat
Normal B-Wave
The following types of flats are included in this category
- Common flat
- Flat with a c-failure
- Elongated flat
Strong B-Wave
Here, we can include:
- Flat with an irregular failure
- Irregular flat
- Elongated flat
On top of all these types of flats listed above, a running flat pattern also exists. More about these types of flats in other videos and articles part of this educational series.
Examples of Possible Flat Patterns
Flats are common patterns forming on all markets. Either simple corrections or part of a complex one, flat patterns are everywhere.
EURUSD – A Possible Flat Pattern
 2021 brought a possible flat pattern on the EURUSD daily chart. The market started the year with a bearish tone, effectively correcting ever since.
We see the pair dropping from its 1.23 highs in January to below 1.18. the drop was followed by a strong retracement – the pair traded above 1.22 in May-June this year.
Because the retracement went beyond 61.8%, we might say that the minimum condition for a flat has been met. But the b-wave retraced more than 80% of wave a, so the flat belongs into the normal b-wave category.
All traders need to find out now is if the c-wave, the impulsive move, is completed. If yes, the flat ended and Elliott traders must decide if the flat is an individual corrective wave (i.e., a simple one) or a complex one.
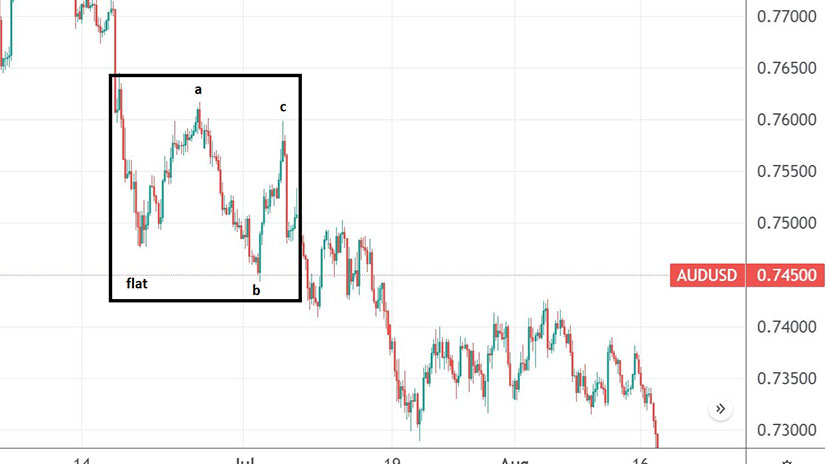
AUDUSD – Flat With Irregular Failure
 The AUDUSD pair gave us another example of a flat pattern in 2021. On its drop from 0.80 to 0.71, the pair consolidated for a while, forming a flat pattern. The b-wave’s retracement went beyond the 100% of the wave a, and thus the flat belongs to the strong b-wave category.
Because the c-wave failed to fully retrace the b-wave, the flat is called a flat with an irregular failure. Any flat with a failure signals countertrend strength. Therefore, by the time the c-wave ended, the bearish trend resumed.