
Hello there, this is tradingpedia.com and this video deals with the US housing market, so we are still on the fundamental analysis. The housing sector in the US is one of the most important in the world. In fact, the housing sector is really important for every economy. This is one of the reasons why most PMIs also include the construction component.
Housing Market – Overview
 If there is one event to turn to, this is the 2008-2009 Great Financial Crisis that started from the housing market in the United States. It quickly spread from the United States triggering a global recession and unfortunately many people lost their job – and it all started from the housing market.
For the currency market, the housing sector is very important but the housing sector in the United States is critical. There is no other economy that releases so much information about the housing market like the United States.
For example, if you try to search for the housing sector in Germany, France or Japan, you will have a hard time finding indicators for it. But these indicators, Existing Home Sales, Pending Home Sales, Building Permits, are part of the economic calendar that any trader must use.
Indicators Any Trader Must Use
 The first one is the most important one – it shows the number of homes sales each month and depending on this number you may tell if an economy is recovering or is still contracting. Imagine that you buy a house.
Most people after buying a house they paint it, buy new furniture, contract new services, like a gardener, and so on. In other words, the housing industry triggers on the horizontal demand for goods and services for the local services.
Therefore, if you see an increase in the number of existing home sales, then the economy is likely to pick up. The National Association of Realtors is the one releasing the indicator and last month the indicator increased by 24.7% when compared to the previous month. If you click this link, more details appear.
What’s very important is the seasonal adjusted annual rate. This is the seasonal adjusted annual rate – the number of houses sold in the United States. Here there is the coronavirus pandemic in March and the dip that it triggered, and then a quick bounce – a V-shape recovery.
Why did the sales dipped in the first place and then bounced back? The bounce came because the Federal Reserve of the United States slashed the interest rates, making it easier for banks to sell mortgages and people used the opportunity to go and buy a house. More favorable conditions from the Fed created demand for housing and triggered a chain of economic benefits on the local industry.
The report goes into various details, but what is important is the number of existing houses sold. This dip and the recovery show the response that the Fed delivered.
Another important indicator is the Pending Home Sales. This is only pending, showing an incomplete sale. Maybe there is already a down payment, a precontract already signed, but effectively the house is not sold yet.
Building Permits give you an idea about the new houses about to be built. By the moment that a company obtains a building permit, it has a certain deadline to deliver the construction. It means that during that period of time, the company will contract all kind of goods and services in the area to build the house or the residential complex. Therefore, the bigger the building permits number, the better for the economic growth in the area.
Related Videos
When looking at the housing sector in the United States, consider the Existing Home Sales and building permits as the ones that reflect the strength of the economic activity. The sector employs many people and when a house is sold the new owner usually spends some more in refurbishing and renovating it. It is a leading indicator of economic growth and shows where the economy is on the business cycle and the pending home sales only show the pending transactions. Therefore, out of the three, focus on the existing home sales and the number of building permits.
The Importance of the US Housing Sector
 The 2008-2009 Global Financial Crisis remains in economic history as bringing one of the sharpest contractions in the developed world. It originated in the United States from the housing sector, and triggered a global recession.
During the rest of the article we will have a look at the most important economic indicators to interpret when analyzing the US housing sector. While some were mentioned earlier, more details are needed to fully understand the sector.
Construction Spending
 This indicator shows the monthly amount that the US builders have spent on construction projects. The bigger the number, the better for the currency, in the sense that a higher amount shows increased activity in the housing sector, thus being a positive for the economy.
It is typically released about thirty days after the month ends. For example, if it is released at the start of August, the data refers to the construction spending for the month of June.
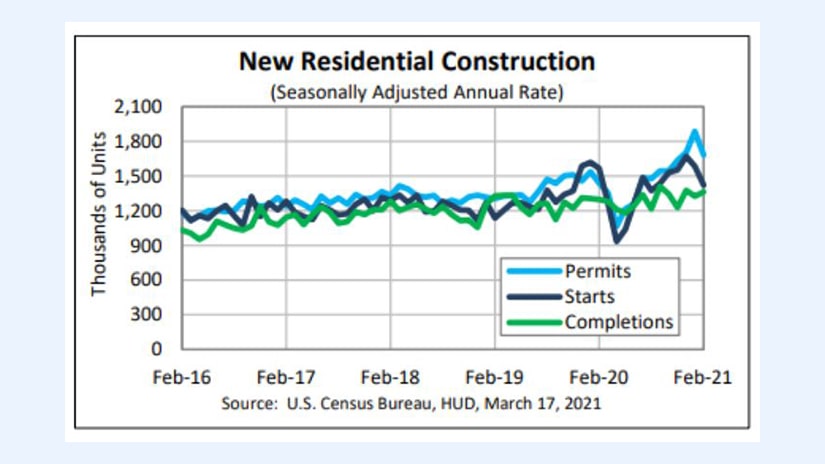
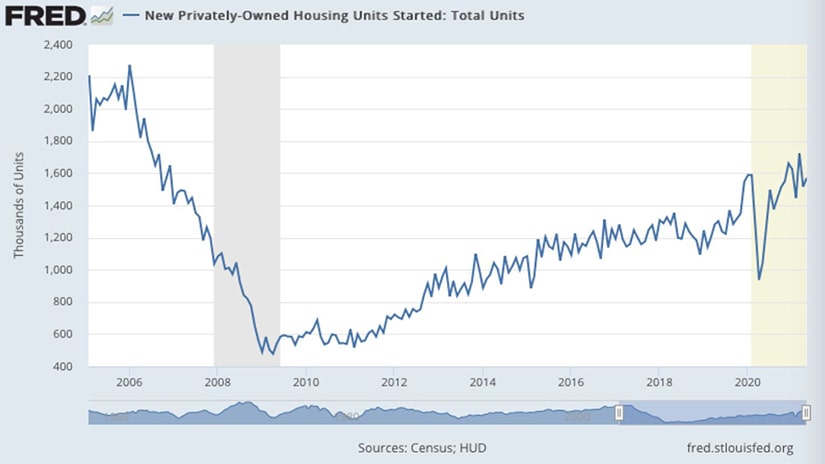
Trends in new residential construction also help. For example, the chart below shows a pick-up in the housing activity during the COVID-19 pandemic after an initial drop.
Building Permits and Housing Starts
 If there are two economic indicators for the housing market to focus on, these are the two. Both are leading indicators of economic activity and very important for interpreting the US economic growth.
Also, both are presented in an annualized format. Effectively, it means that the monthly figure is multiplied by twelve, the number of months in one year.
Building permits reflect the future construction activity. Therefore, it is a leading economic indicator because the first thing to do before starting a construction is to obtain a permit.
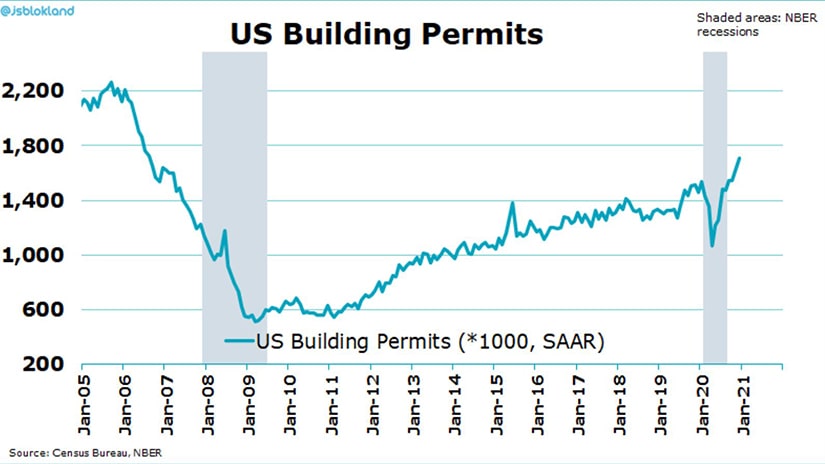
The chart above shows both the 2008-2009 Great Financial Crisis and the COVID-19 pandemic. We see that the building permits were in a declining trend prior to the 2008-2009 recession and in a rising one just before the COVID-19 pandemic.
The easy monetary policy made it cheaper for investors to borrow for long-term projects and thus, the housing activity increased in 2020 despite an economic recession. The number of building permits is released somewhere in the middle of the month, and the data refers to the prior month.
Housing Starts
 Housing starts are tightly correlated to the building permits. The data is usually released together and reflects the annualized number of new residential buildings that started construction in the month before.
Just like building permits, housing starts were in a declining trend prior to the 2008-2009 recession, and they picked up shortly after. Investors remember that the Federal Reserve of the United States adopted unconventional monetary policies, such as quantitative easing, to fight the housing crisis. The tools remained in place for most of the years that passed until the next recession, thus explaining the pick-up in the housing starts.
Existing Home Sales
 Residential buildings sold last month are reflected in the existing home sales number. Just like other housing data, this one is also presented in an annualized format.
It does not include new constructions and is released during the last part of the trading month, typically about twenty days after the previous month ended.
New Home Sales
 Many traders wonder what is the difference between existing home sales and new home sales? The answer is that the new home sales number reflects only the number of new single-family homes sold in the previous month.
The indicator is typically released one day after the existing home sales number in an annualized format.
Pending Home Sales
 Pending home sales show the number of homes under contract to be sold, but not yet sold. It does not include the new constructions and it is presented as a percentage.
Released one week after the existing home sales, this indicator offers an educated guess about the upcoming trends in the housing market activity. This is a forward-looking indicator and thus offers valuable information to traders regarding the housing market activity.
Other Things to Consider When Interpreting the Housing Sector
 So far we’ve discussed only indicators that refer to the number of units sold or about to be sold. However, the housing sector data needs to be interpreted in the overall economic context.
The trends in the price of houses sold also offers a good indication about the economy and the housing sector. The chart below shows the median sales price of houses sold in the United States in the last six decades, reaching an all-time high recently.
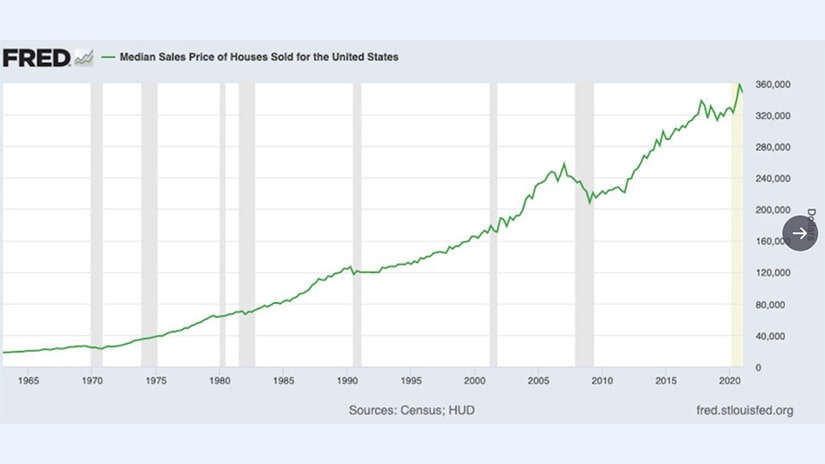
One explanation could come from the rising inflation. But a close look at inflation trends over the period does not reflect a similar increase.
Another explanation for the rising price of a home is scarcity. Supple and demand imbalances are responsible for dramatic increases in price.
Changes in demographics are another driver of higher housing prices. Simply put, in the last decades, the population increased while the number of houses failed to keep up with the pace.
Increasing or decreasing activity in the housing sector may trigger economic growth or stagnation/recession. Because of that, traders look at all the available information to understand where the economy is going.
In some parts of the world, there is a special PMI dedicated to the construction sector only. For example, the United Kingdom and Australia calculate a PMI for the construction sector, to better monitor the activity. Therefore, besides the PMI manufacturing and services, one PMI for construction is calculated, monitoring the sector’s expansion or contraction on a monthly basis.
The employment component is also relevant. Rising employment suggests a pick-up in the construction activity with ripple effects throughout the economy. For example, after a new house purchase, the new owner typically starts some renovations, the bank probably sold a mortgage, and real estate agents earn commissions.
Therefore, the pick-up in the housing activity triggers economic growth and thus is a positive for the currency.