
Hello there, this is tradingpedia.com and this video deals with the concept of the x-wave with the Elliott Waves Theory, also called the intervening or the connecting wave, because its purpose is to connect two simple corrective waves. To properly understand how the Elliott Waves Theory works, the idea is to connect some videos with some other ones so there is some continuity when explaining the concept.
The X-Wave – Overview
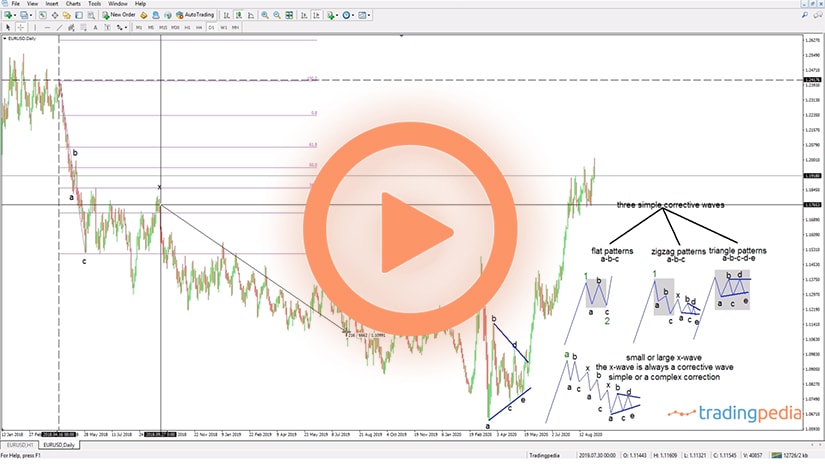
The x-wave, or the intervening wave, connects simple corrective waves. Because there are only three simple corrective waves – flats, zigzags and triangles – the x-wave connects them into complex corrections. When the market does not confirm them as simple corrections you have only one other option – the market forms a complex correction. And then, an intervening x-wave appears.
Such a wave is of two types – small or large x-wave. Once again, the Fibonacci ratio comes and makes the difference between the two. If the x-wave retraces more than 61.8% out of the entire previous pattern, then the market forms a complex correction with a large x-wave. If it is a small x-wave, the market won’t retrace more than 61.8% of the previous a-b-c.
Also keep in mind that the x-wave is always a corrective wave. Moreover, it means that it is labeled with letters, not numbers of a lower degree. It can be a simple or a complex correction. More precisely, it can be a flat, zigzag, a triangle or a combination of these patterns with an x-wave of a lower degree.
To understand the x-wave you must look at the price action that follows the first corrective wave. If the first corrective wave is a flat, in order for the market to form a simple correction, it means that this cycle must end something of a bigger degree. So this was, let’s say, the first way, this is the second wave, and this a-b-c in this case is simple, there is no x-wave. The price to follow must retrace the entire c-wave in less than the time it took for the c-wave to form. If that happens, the second wave ended, and this is part of the third wave of this degree.
But if the market goes like this, this is not retraced, it means that it is not a simple correction and the market forms a complex correction. So what follows after the first a-b-c, or the first correction? An x-wave.
The next thing to do is to interpret the nature of the x-wave in the sense that we must look at how much it retraces into the territory of this a-b-c. We take a Fibonacci retracement tool and simply drag it from the start of the first a-b-c to its end. End then we check where the x-wave ends.
Double and Triple Combinations
If it retraces more than 61.8%, the market forms a complex correction with a large x-wave. Into this category we have double and triple threes, double and triple threes combinations, and so on. They are rarely forming – not so often like double or triple combinations. Double and triple combinations are patterns that have a small x-wave, meaning that the market retraces less than 61.8% of the first a-b-c.
If the time that it took the c-wave to form expires, and the market goes like this, this is complex correction with a small x-wave. This structure is corrective as well, but of a lower degree. It could be a triangle, like this one, but here.
The x-wave can also be a complex correction – a double or a triple combination on its own. So, in this case, if this a-b-c is a simple correction, then there is no x-wave and the market must go like this.
But let’s assume that this is the end of the x-wave, right here, and then the market goes a-b-c. The price action that follows fails to fully retrace the c-wave in less than the time it took the market to form and the market goes like this. If we take 61.8% from here to here, we see that this x-wave actually fails to retrace more than 61.8%. It means that this is a complex correction, one with a small x-wave. Whenever you here this, the first thing to consider is a double or a triple combination because they are the most common ones. Or, a double zigzag or a triple zigzag.
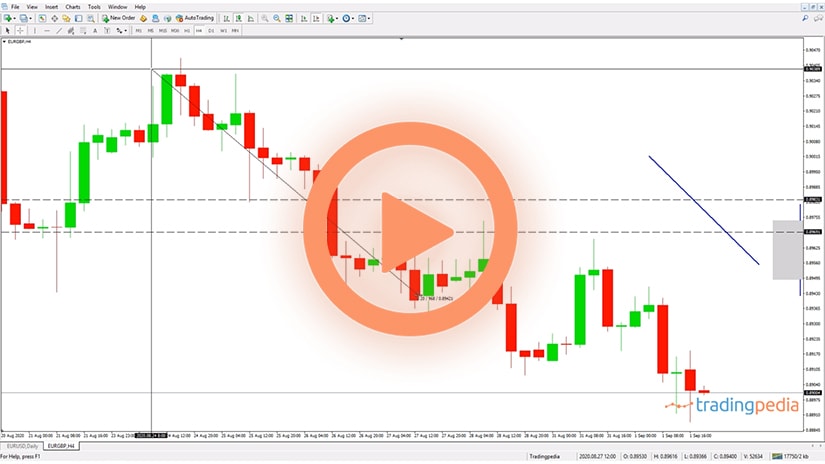
Usually, double or triple combinations end with a triangle – like this one, or of a different shape, one that makes multiple lows, for example. This is called a double combination and we will discuss it on the next video as we will illustrate it on the chart with the EURUSD in front of us.
Related Videos
Sum Up
To sum up, x-waves are intervening waves, they connect two or three simple corrections, any complex correction does not have more than three simple corrections, they can be either simple or complex, and they are of two types (small and large). Those small travel less than 61.8% of the first a-b-c, and those large more than 61.8%.
Thank you for being here, bye bye.