
Hello there, this is tradingpedia.com and this video deals with support and resistance – horizontal support and resistance levels in technical analysis, a concept that fascinated markets for ages, since the stock market in the United States was launched a century ago.
Horizontal Support and Resistance – Overview
 Horizontal support and resistance, like the name suggests, forms on the horizontal. The price keeps trying against a horizontal base, it builds energy, until, eventually, breaks higher – this is called resistance. Often, when the market reverses to the same area, resistance turns into support. Previous resistance turns into support. Or, if it breaks lower, then support turns into resistance. This interchangeability between support and resistance is a very important concept in technical analysis.
Support and resistance also take place on a dynamic level, meaning that support and resistance follows the price, meaning that the market may even form a new high or low, depending on the trend, while at support or resistance.
An Example
 Imagine the price action here, for instance. Let’s assume that the market is rising, and this is a trendline. The trendline represents support and even if the market makes a new high, it still comes at support. And even if it breaks the support in terms of a trendline, if it doesn’t break the series of higher lows, it is still acceptable. This is called dynamic support and the market may break it and even make a new high at resistance – this is called dynamic resistance. Let me show it to you again – this is dynamic support and then support is broken, support turns into resistance, but on a dynamic level. Out of the two situations, dynamic support and resistance levels are more powerful.
The bigger the timeframe, the more important the support and resistance level. If you want, this is a concept of market geometry, but it goes beyond market geometry in the sense that it refers to levels that may still form a high and a low in a rising or a lower trend.
Related Videos
Tips and Tricks
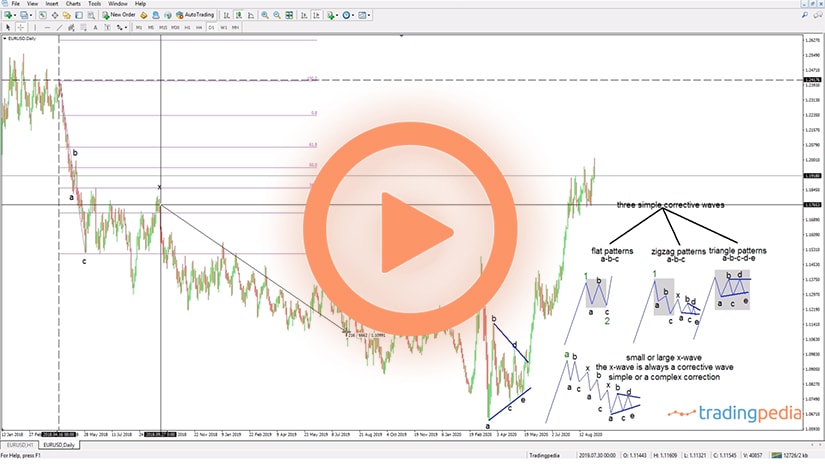
 Let’s see some levels. This is the EURUSD on the monthly chart, a timeframe available on any broker. Remember, dynamic resistance and support are much more powerful than horizontal ones. This being the biggest timeframe of all offered to the retail trader, we must consider it moving forward.
If we take a trendline and connect these lows we see that the EURUSD, when it dropped from 1.40 when Mario Draghi came at the help of the ECB, it found support above this trendline. This trendline shows dynamic support. How do we know that? Well, this was support once and the EURUSD was supposed to react at this trendline, to have a difficult time to break it.
This is not a timeframe a trader would like to use, but from the bigger timeframes all we do is we take our support and resistance levels and then on the lower timeframes we trade. If you are short, for instance, on such a pattern on a bigger timeframe, based on a possible rising wedge and the market collapsed, you will want to at least book partial profits on dynamic support on the monthly chart. One might say that support is broken – no, it is not broken. When support is broken, look for the candlesticks to not reach the trendline anymore. Look for some empty space in between. All these candlesticks still touch the support, giving the impression that the market wants to come back. And it did come back.
This was 2015 when, for the first time, the EURUSD reached dynamic support. Then it tested it again ten months later, and again a year-and-a-half later, rejected from support as it was supposed to, and came back to it in 2019. Even in 2020 it was still at the level.
If we look at this area, not only that it was a dynamic support, but the market also reacted to a horizontal support. The market tried at dynamic support and then reversed higher, but somehow remained in contact with the dynamic support. At the same time, it reached horizontal support, reacting at a confluence area. You don’t want to mess with such an area, especially on the monthly chart.
Support and Resistance Concepts Explained – Examples
 One of the first concepts in technical analysis is support and resistance. Ever since traders took an interest in charts and patterns, it became obvious that the price action hesitates against certain levels.
At first, it was only about horizontal support or resistance. The market advances or declines until it reaches a certain area and then quickly bounces from it.
Technical analysis involves interpreting past price action to forecast future market moves. Therefore, if the market reacted in the past from a specific area, the chances are that next time when it reaches the same area, a similar reaction is expected.
Not to be said that a similar reaction is warranted, but that traders became aware of the importance of a certain level and booked profits or avoided trading right there and then. This is how support and resistance concepts were first introduced in technical analysis, and they belong to classic concepts, the very early ones ever discovered.
In time, the new tools available to the technical trader took the concept further. Nowadays, traders do not use pen and paper anymore. Instead, trading platforms are full of tools ready to be used to identify technical patterns and levels.
Before looking at some examples, there are some things to mention so that the technical trader is aware of. First, support and resistance levels respect the interchangeability principle. That is, when a support level is broken, it becomes resistance. Similarly, when resistance is broken, it becomes support.
Second, support and resistance levels do not form only on the horizontal. Technical traders are familiar with the concept of a double top or bottom, triple top or bottom, or ascending and descending triangles. All of them involve horizontal support or resistance, but dynamic levels also exist.
Fibonacci Retracement and Horizontal Support and Resistance Levels
 Our first example involves Fibonacci ratios. Fibonacci levels have a major importance in technical analysis, starting with deriving support and resistance levels, to properly counting market waves with the Elliott Waves principle.
Below you can see the AUDNZD weekly chart. As a rule of thumb, when it comes to support and resistance, the larger the timeframe, the more difficult it is to break them.
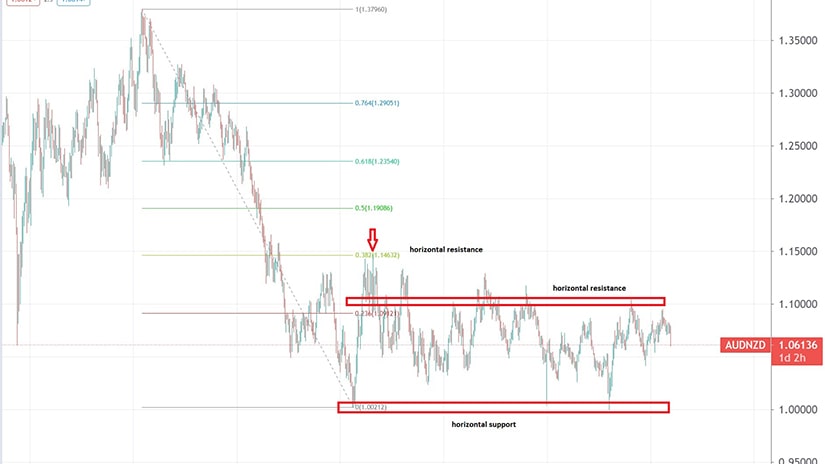
In this case, we see the AUDNZD cross falling from 1.35 in 2011 to parity (i.e., 1) in 2015, and consolidating on the horizontal ever since. Of course, no one really trades the weekly chart, unless they are a hedge fund or an institutional investor with a long-term perspective.
For the retail trader, that is usually not the case. However, the retail trader can use the larger timeframe to spot levels of support or resistance and then trade accordingly on the lower ones.
To exemplify, if the market fell to a 2015 low and then bounced and reached the 23.8% and 38.2% Fibonacci, that is an area of resistance. Put it simply, it does not mean to sell at these levels, but more to avoid being long when the market comes close to the area.
For the last six years, the 1.10 and the 1.00 levels offered significant resistance, respectively support for the AUD/NZD pair. Simply trading the range would have been profitable for any swing trader, but ideally a trader would look for reversal patterns on the lower timeframes once the price reaches resistance or support.
EURCAD – Building Energy to Break Horizontal Resistance?
 Our next example comes from the EURCAD weekly timeframe. The market was under severe pressure during the COVID-19 pandemic because the price of oil recovered from negative territory and rallied all the way to above $60.
As the chart below shows, this translated into the EURCAD dropping from 1.60 to 1.47, mostly on a stronger Canadian dollar as it is directly correlated with the price of oil. But a close look at the bigger picture reveals that the pair hesitated at the 1.60 areas a couple of times before.
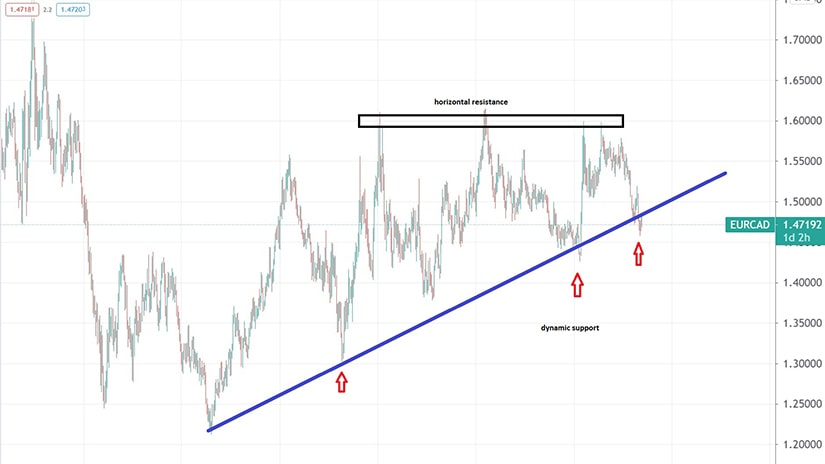
Because of that, we may say that the 1.60 area acted as resistance on the weekly timeframe – quite a significant one. Moreover, on every attempt lower, the market was not weak enough to break the series of higher lows. Hence, the price reacted from a trendline (i.e., dynamic resistance) and possibly builds energy to break the horizontal one.
USDCHF – An Example of Horizontal and Dynamic Resistance
The next example comes from the USDCHF daily chart. The 1.02 area acted as a strong horizontal resistance, both before and after the SNB dropping the EURCHF exchange rate floor.
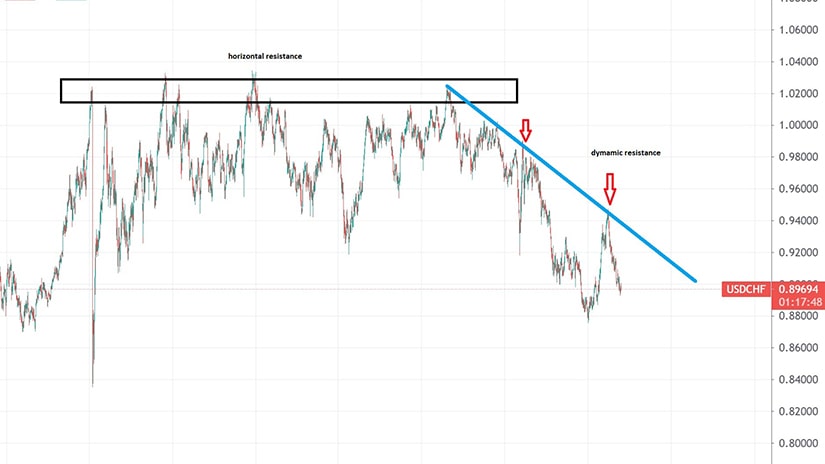
After the last rejection, the market made a new lower low, and that is the moment when a bearish trendline signals dynamic resistance this time. As long as the price action remains below the blue line, the USDCHF bulls will have a hard time on any attempt to buy the pair.
Dynamic Resistance on the USDJPY Daily Chart
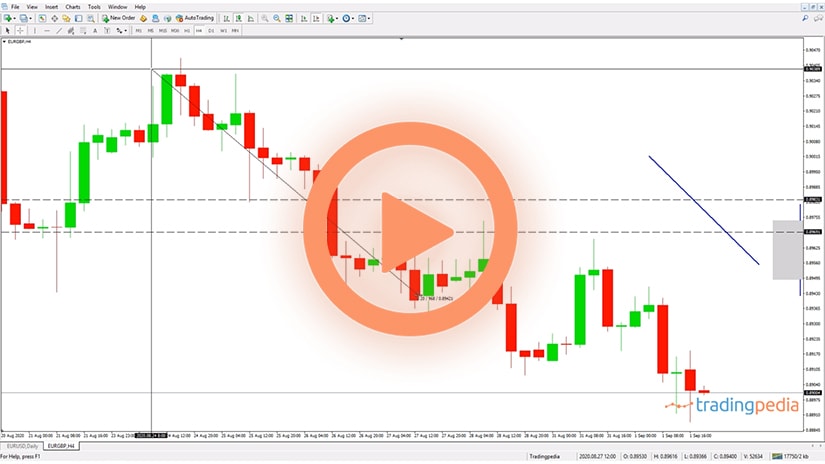
One of the best charts to illustrate the concept of dynamic resistance is the current USDJPY daily timeframe. The market rallied from close to 100 all the way to above 110, only to meet a trendline that offered resistance for quite a while now.
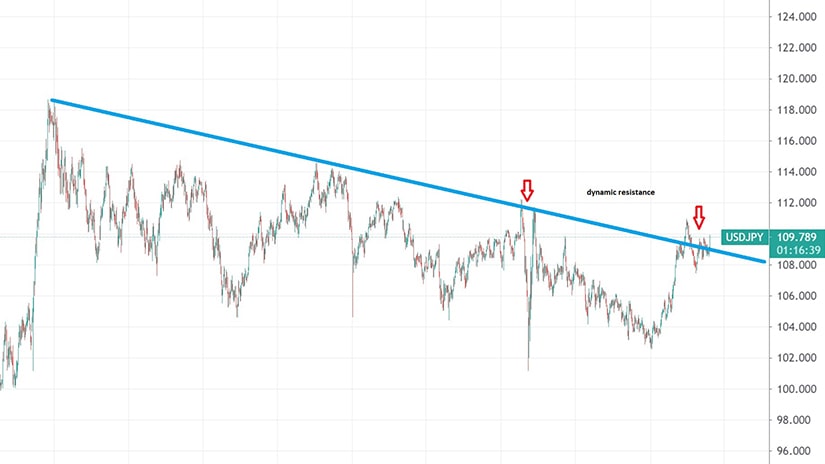
Remember that dynamic resistance follows the price, meaning that every time the price attempts at breaking the level, traders typically reduce exposure being afraid of rejection. So far, the USDJPY reacted once at the dynamic resistance, and now it is struggling to break higher.
It does so for several weeks now, and even if it manages to clear the level, bullish traders have already reduced exposures. The key here is to monitor the lower timeframes in search of either bullish or bearish patterns, such as a pennant on the 4h chart or an evening star.
To sum up, support and resistance levels can form both horizontal and dynamic, with the latter ones having a stronger impact on the price action. Also, if the price action retests the level multiple times, it is a sign that a breakout is imminent. Finally, after a breakout, support becomes resistance, and resistance becomes support.