Hello there, this is tradingpedia.com and this video deals with different types of contracting triangles. This is the most common pattern in technical analysis. It is not only one type of a triangle that you may see on a chart but there are other ones, especially when using the Elliott Waves Theory.
But this is not the Elliott Waves Theory, it is only to introduce the notion of a contracting triangle in relation to the price action.
Overview
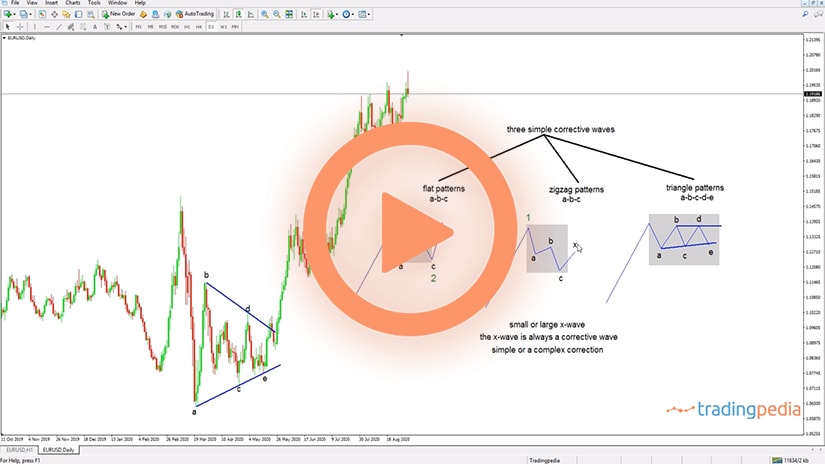
Everyone knows the classic contracting triangle – the market advances, and then forms a contracting triangle. For instance, it goes a-b-c-d-e and then pops up. The contracting triangle, which has five segments, always breaks out of the b-d trendline, while the a-c trendline shows the characteristics of a triangle.
In reality, this rarely happens, because triangles as continuation patterns, when they form, they are either the x-wave of a complex correction in Elliott Waves or the 4th wave in an impulsive move.
Symmetrical Triangle
This is a contracting triangle that has all the segments smaller than the previous ones – called a symmetrical triangle, or a horizontal contracting triangle. Imagine here – if this is a-b-c-d-e – this is a horizontal or symmetrical contracting triangle and in this arrangement the a-wave is bigger than the b-wave, which is longer than the c-wave, and so on. Therefore, whenever the segments of a triangle are smaller than the previous ones, you have a horizontal contracting triangle.
Such a pattern in the currency market is not that common. What it is common is that you will have the b-wave longer or bigger than wave a, for instance. That is an irregularity and in that case the b-wave looks like this, but the triangle still contracts. If you imagine a b-d trendline here, the pattern it still a triangle that shows continuation.
Pennant Pattern
In this arrangement it is often forming a pattern called pennant – the market builds energy to pop higher and the market builds energy that it contracts into the apex of the triangle before pushing higher. Another arrangement is that you may have a bearish trend and you will have the a-wave like this, a longer b-wave, a c-wave shorter than the b-wave, a d-wave even longer than the c-wave, and then with the c-wave. And then breaks lower.
What is this? This is a triangle. Judging by its definition, if we connect the a-c trendline and the b-d one we see that they contract. This is called a running triangle – we will have a special video for this pattern – and these triangles are common in the currency market.
The uglier the pattern, the more powerful it is. Rarely you will see a perfect ascending or descending triangles in the currency market.
Examples
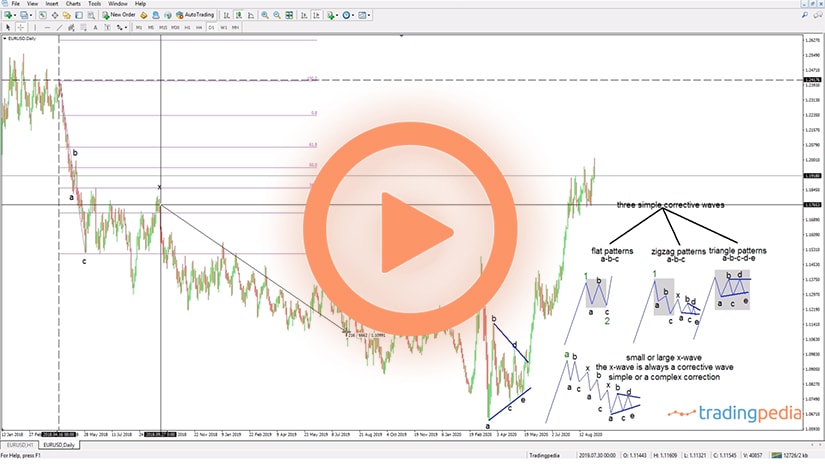
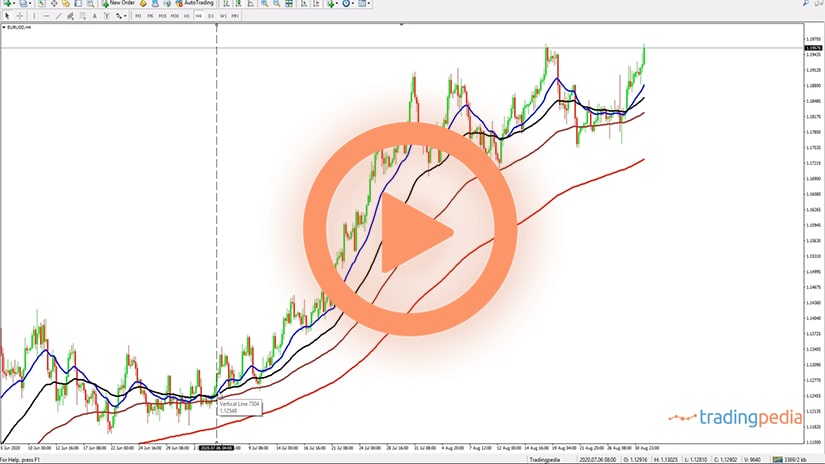
Let’s look at some examples because triangles are everywhere. Let’s go back on the left side of the chart and in November 2016 the EURUSD moved lower and it formed a triangle – a-b-c-d-e. This is a triangle that acted as a reversal pattern. Very often you will have triangles at the end of complex corrections or at the end of strong trends when the market reverses from a triangle. It is usual that the market pierces the a-c trendline before breaking the b-d one.
Also, usually the b-d trendline is retested. The market advanced and then at 1.25, in 2018 what did it do? It formed a triangle – a-b-c-d-e. All we have to do is to connect the points and find the trendlines to see the triangle.
It shows the market pushing at the highs and failing, forming lower highs before breaking lower. Even here, the market forms a triangle as a reversal pattern.
Even here, at the current price, the EURUSD forms three higher highs and the price action looks like a triangle. Not all triangles are contracting – some of them are expanding and different types exist too.
Related Videos
At this point in time consider that triangles are everywhere, they do not act only as continuation patterns (as a matter of fact, most of the times in the currency market they act as a reversal pattern) and the uglier the pattern is, the more powerful it is.
Contracting Triangles Generalities
The name says it all – the price action during a contracting triangle’s consolidation is contained by two trendlines that converge toward one common point. That point is called the apex of a triangle and is the subject of a different topic covered here on our website.
Contracting triangles act in two ways – as continuation or reversal patterns. Regardless of the future market direction, trading contracting triangles follow the same rules.
The concept of a contracting triangle was best explained by Ralph Elliott when developing the Elliott Waves Theory. Since then, contracting triangles of various types and shapes were identified by technical traders, such as irregular or running ones.
A contracting triangle is made out of five segments. To help visualize them, traders use letters – a,b,c,d,e. The same letters define the triangle’s trendlines – the a-c and b-d trendlines.
Out of the two, the b-d trendline is the most important one. A breakout of this trendline is decisive for the interpretation of the future price action.
Depending on the type of contracting triangle, the price action might or might not retest the b-d trendline after its breakout. In other words, it is not mandatory to be retested.
Triangle as a Continuation Pattern
A triangle as a continuation pattern is just a consolidation area during a bullish or a bearish trend. More precisely, the market pauses for a while, takes a breather before the next move.
Consolidation happens for various reasons. When forming on the lower timeframes, consolidation forms mostly during the Asian sessions or ahead of important economic data to be released in the United States.
On the other hand, when forming on the bigger timeframes, consolidation forms ahead of central bank decisions, such as the FOMC Statement or the ECB press conference that followed its interest rate announcement.
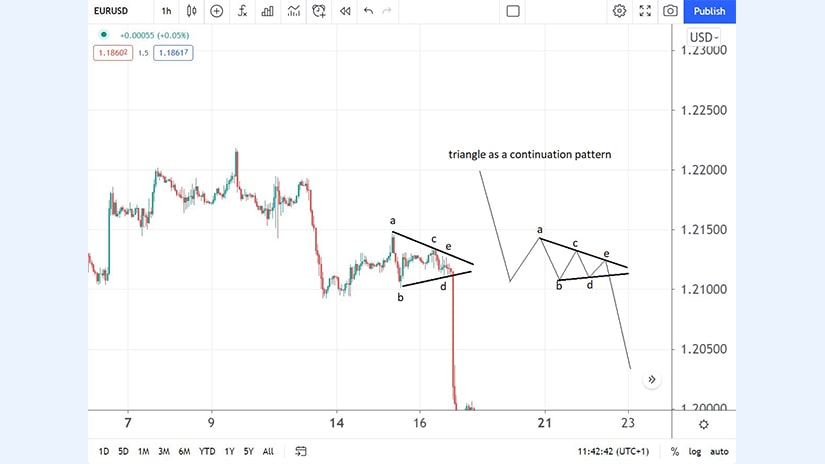
The EUR/USD chart seen below is showing the recent price action above 1.21. The market came down from 1.22 and then consolidated on the horizontal, forming a contracting triangle.
One important economic event was the cause for the three-day-long consolidation – the FOMC June meeting. The Fed surprised the market participants with its hawkish tone during the meeting, suggesting more rate hikes are possible earlier than the market anticipated.
The news sent the EUR/USD lower, as the price action broke the b-d trendline without retesting it. As such, the triangle acted as a continuation pattern because the triangle’s breakout was in the same direction (i.e., bearish) as the previous trend.
Triangle as a Reversal Pattern
Not all triangles are continuation ones. Earlier technical analysts settled for two types of triangles only – ascending and descending.
But later studies showed that many triangular patterns are reversal ones. In fact, in today’s financial markets, triangles acting as reversal patterns form more often than the ones that act as continuation ones.
Once again, triangles as a reversal pattern were best documented by Ralph Elliott. They appear to form at the end of complex corrections and almost always the price action after the b-d trendline’s breakout retest it.
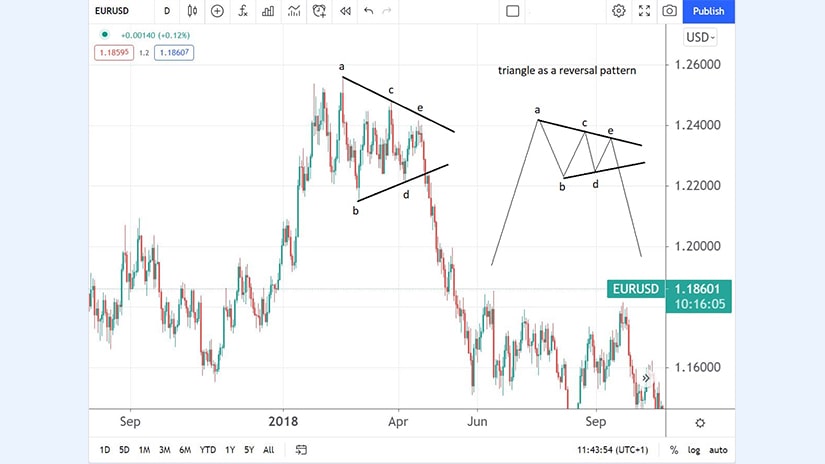
Our example comes from the same currency pair – the EUR/USD. Only this time, the triangle formed on the daily timeframe.
Traders should focus here on the retest that followed after the b-d trendline is broken. For one full trading day, the market retested the trendline for one full day before plunging from 1.22 to below 1.16.
The triangle follows the same rules – it still has five segments, labeled with letters. The only difference is that it acted as a reversal pattern at the end of a bullish trend.
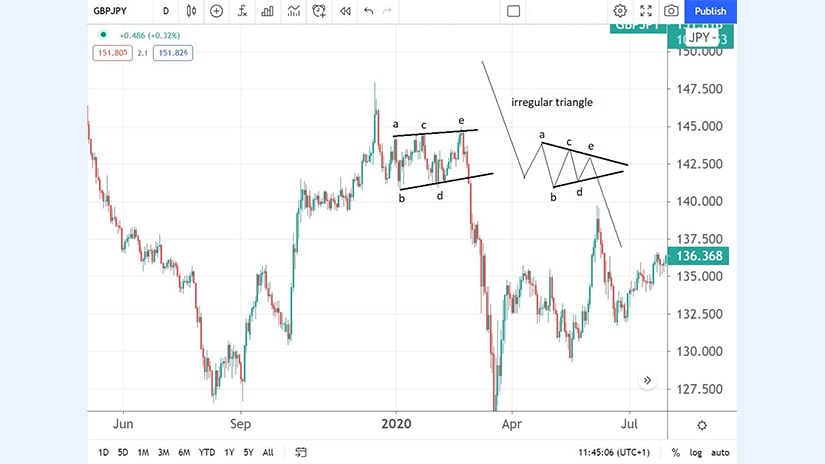
Irregular Triangle
An irregular triangle is just a variation of a classic, symmetrical triangle. Studies on contracting triangles revealed that all segments that follow are smaller than the previous one.
In other words, a>b>c>d>e.
The rule is valid in an irregular triangle, too, with one exception. That is, the b-wave is bigger than wave a.
But even here, there is a limitation. Fibonacci ratios come to help, as the b-wave must be smaller than the 261.8% extension of the previous a-wave.
However, rarely the price action is so big during the b-wave’s formation. Instead, expect to find similar triangles like the one below.
Irregular triangles are more powerful than symmetrical ones. It means that after the price action breaks above or below the b-d trendline, the market travels faster than before. Also, irregular triangles can act both as continuation and reversal patterns.
Running Triangle
The most interesting type of triangle is a running one. As the name suggests, a running triangle ends above (if it is bullish) or below (if it is bearish) its starting point. Other than that, nothing is changing, with one small detail. That is, the price action following a running triangle is very aggressive.
Let’s study the running triangle on the GBP/JPY daily chart seen below.
In such a pattern, wave a is smaller than the wave b. Just like in an irregular triangle.
However, in a running triangle, the d-wave fully retraces the previous b-wave. The bigger the retracement, the stronger the price action that follows the triangle’s breakout.
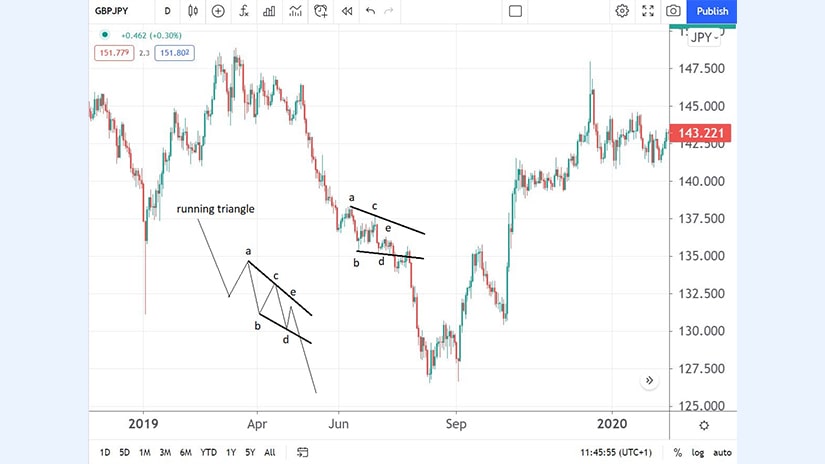
What is important in such triangles is the fact that the e-wave ends below the point where the a-wave starts (in a bearish triangle). Because of that, the triangle has a “running” shape.
Running triangles were found to be the last phase of complex corrections. According to the Elliott Waves Theory, running triangles are often found at the end of the second wave in impulsive structure.
Effectively, it means that the third wave that follows is the extended one, with almost no pullbacks. Therefore, when a running triangle forms, the technical trader must pay attention.
Summing up, contracting triangles are not the only triangles that exist. Expanding triangles do appear as well, but they are patterns that form extremely rare.
Traders should always keep an eye on the b-d trendline’s breakout. Trading with pending orders may be the right way to deal with contracting triangles because the price action that follows is often so aggressive that the trader may miss the entry.
