
Hello there, this is tradingpedia.com and this video deals with bullish and bearish engulfing. These are Japanese candlesticks reversal patterns, and this is the reason why we have such big candlesticks on the chart.
Every trader is familiar with these patterns, but most of them are wrong because the true bullish and bearish engulfing pattern forms quite rare on the FX market and the timeframe is very important. Before searching for examples, let’s define the rules for bullish and bearish engulfing.
Two-Candlestick Pattern
 These is a two-candlestick pattern – one candlestick like this followed by another one. The real body of the candlesticks can be either green or red, depending on the trend’s nature, and they many have upper or lower shadows.
For instance, let’s assume that the market is in a falling trend. Then, at one point in time, it forms an aggressive candlestick that doesn’t show anything, with a very strong real body, bearish, and with an upper shadow that tells you more about the aggressiveness of the pattern. But its shape doesn’t matter.
At one moment, a new candlestick forms, that totally engulfs the previous candlesticks real body, without engulfing the upper shadow. If it does engulf the upper shadow, that is not your pattern. And this is the mistake that many traders do.
Examples of Bullish and Bearish Engulfing
 Let’s have a look at some examples of bullish and bearish engulfing. We see here that the market travels to the upside in a bullish trend, and then at one point in time forms a candlestick. And then the second candlestick fully engulfs the body of the previous one, but also the lower shadow – this is not possible in such a pattern. Moreover, this pattern does not fit the “bill” if you want, because the real body of the two candlesticks are supposed to be equal and in this case the difference is quite big.
If we continue searching for examples, we see here that the market is still in a bullish trend. Suddenly, the market forms a bullish candlestick – nothing signals that a reversal pattern is in the making. Then another candlestick follows and engulfs the real body of the previous candlestick. However, it engulfs the lower shadow again and this is not a bearish engulfing pattern.
For it to be valid, the price on the second candlestick should have closed beyond the opening price of the first candlestick without engulfing the lower shadow belonging to the first candlestick in the pattern. You might say, well, these are really rare patterns – they are, but for a reason. When you find one, it is like finding a gem in technical analysis, especially if they form on the bigger timeframes because they provide risk-reward ratios that other patterns fail to do.
Here, for instance, we have a true bullish engulfing. We have a bearish trend and at one moment, at the bottom, we have a candlestick with a strong real body followed by a candlestick with a totally opposite real body that closes beyond the previous candlesticks’ opening price but without engulfing its shadow.
This is a bullish pattern, a reversal pattern that tells us that the correction ended and a new trend higher is about to start. How to trade it?
We use two horizontal lines to mark the lows and the highs in the pattern. In this case, the highs and the lows in the pattern belong to the same candlestick. That’s alright. Then we found out 50%-61.8% of the range, using a Fibonacci Retracement tool, and this is where we want to go to the long side with a stop-loss order at the loss. Why such an order? The stop is mandatory because often bears will try to take control here.
If you see a Japanese reversal pattern that fails to threaten the lows or the highs, try to ignore that pattern because usually it is a false breakout. So, this would be the risk and the reward can be projected three or four times to the upside, depending on the aggressiveness of the trader, on the available margin in the trading account, on the tactic, and so on. Some traders use 1:3 risk-reward ratios and by the time the market reaches 1:3, that should be the exit. But some others try to trail the stop, leaving a bit of a distance between the candlesticks. For example, the market keeps advancing and by the time it reaches 1:3 or so they move the stop to break-even. From that moment on that is a risk-free trade and then you look for reversal patterns or continuation pattern either to add on the trade or to book the profits.
Related Videos
Bullish and bearish engulfing patterns are two-candlestick patterns, the second candlestick must engulf the previous candlestick’s real body, but not the shadow. Because they are reversal patterns, they form at the end of bullish and bearish trends and to trade them, measure the high and the low in the pattern, find the 50%-61.8% retracement level, go long or short, place a stop at the top or bottom, measure the risk, project it three times from the entry place and that is the reward for a risk-reward ratio of 1:3.
But because they are such rare patterns, they provide risk-reward ratios much better than other patterns do.
How to Trade the Engulfing Pattern
 The engulfing pattern belongs to the Japanese candlestick patterns, and it shows a reversal. As the name suggests, a bullish engulfing forms at the bottom of a bearish trend, while a bearish one appears at the bottom of a bullish trend.
The pattern is made of two candlesticks, with the first one going in the same direction as the underlying trend. Effectively, it means that the first candlestick in a bullish engulfing is bearish, while the first candlestick in a bearish engulfing is bullish.
Nothing appears to suggest that a reversal is in place, because the market trend is confirmed by the first candlestick. However, the second candlestick fully retraces the first one, in a sign that the trend is reversing.
Here are the conditions for a bullish engulfing:
- A bearish trend must exist
- The first candlestick has a strong, red, real body (i.e., the distance between the opening and closing prices)
- The second candlestick has a strong, green, real body (i.e., the distance between the opening and closing prices)
- The second candlestick’s real body must fully retrace the first candlestick’s body
- When engulfing the first candlestick’s body, the second candlestick must not engulf the upper shadow too
Naturally, the conditions are just the opposite in the case of a bearish engulfing pattern. Out of the five things to consider when trading the engulfing pattern, the last point is the most important one.
Most traders missed it, but if the second candlestick engulfs the previous candlestick’s upper shadow the pattern is not valid. This is a rookie mistake, and if you got this one right, trading the engulfing patterns is straightforward.
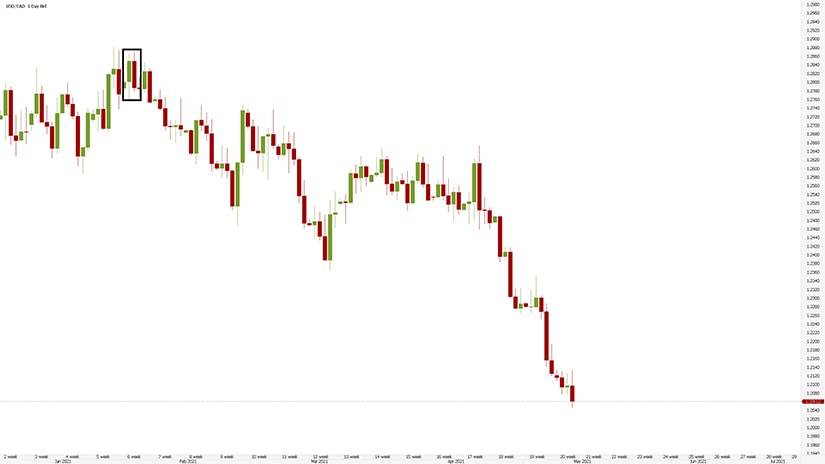
USDJPY Example – Bearish Engulfing
 The beauty of Japanese candlestick patterns is that they need only a few candlesticks to complete. In this case, only two. Some other patterns need three (e.g., morning and evening stars), or just one (e.g., Doji, hammer, shooting star).
Also, their simplicity attracts traders. Here is the USDJPY weekly chart, with a recent USDJPY bearish engulfing pattern. No matter the timeframe, the rules of trading a bullish or a bearish engulfing are the same.
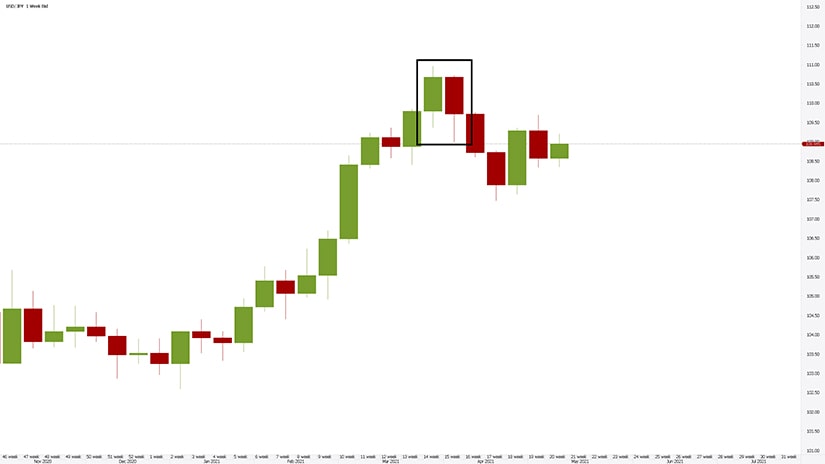
The two candlesticks in the black rectangle formed a bearish engulfing. Note the criteria to use to properly identify the pattern. A bullish trend exists. Next, one candlestick has a strong bullish body. Then, the following candlestick’s body fully engulfs the first candlestick’s body, but not the lower shadow.
Rules to Trade the Engulfing Pattern
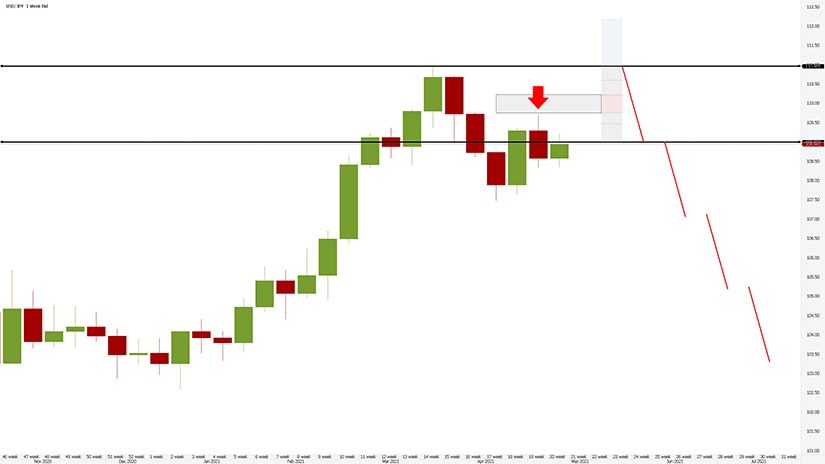
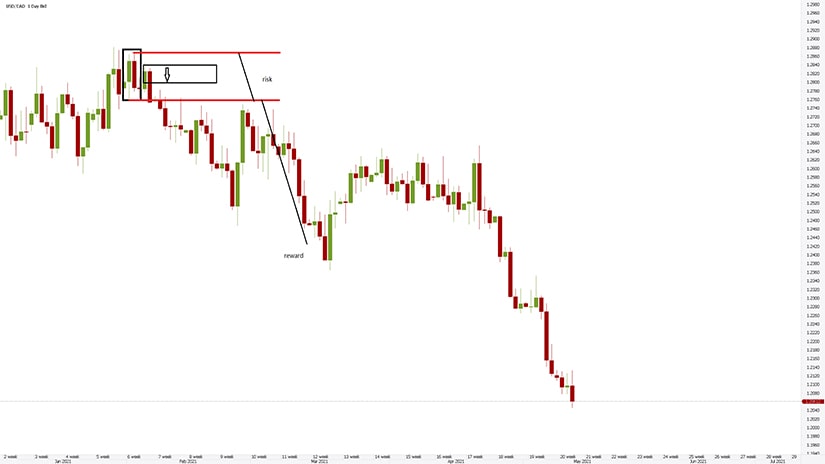
 After identifying the pattern, the first thing to do is to mark its highest and lowest points. The range defined this way helps building the risk management for the trade.
Moving forward, use a Fibonacci Retracement tool to find out the 38.2% – 61.8% level. That is the entry level for a short trade.
The stop-loss order must be placed at the highest point in the pattern. As such, the distance from the entry level to the stop-loss represents the risk. Usually, traders risk 1% or 2% per any single trade, and the bigger the risk, the bigger the reward should be.
If we assume a risk of 1% per trade, the reward must be set in such a way that the resulting risk-reward ratio is set at minimum 1:3. Effectively, it means that for every 1% trade, the trader stands to make 3%. By using this rule, it means that even if three consecutive trades end up losing, one trade is enough to make up most of the lost ground.
In the FX world, a risk-reward ratio of 1:2 is considered appropriate. However, the Japanese candlesticks pattern offer better opportunities than that, so risk-reward ratios even bigger than 1:3 are not out of the question.
A close look at the setup below reveals that the risk-reward ratio, in this case, exceeds the 1:3 discussed above. That is because the entry is at 38.2% retracement, so the risk is much smaller.
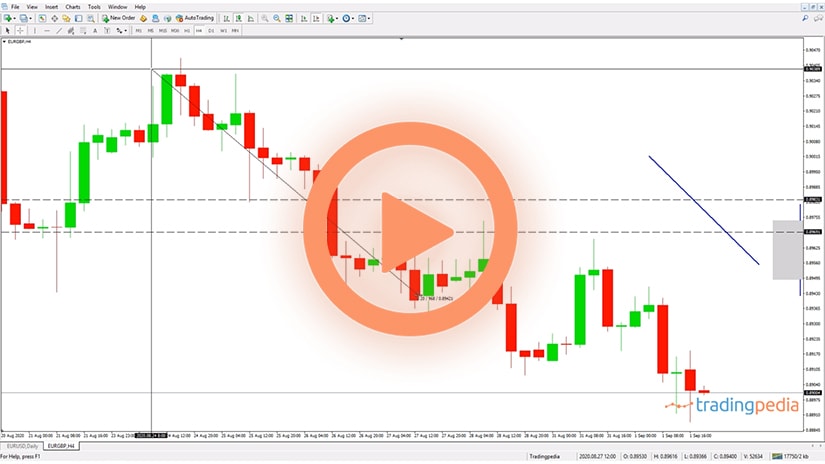
USDCAD Daily Timeframe – Another Bearish Engulfing Example
 The USDCAD daily timeframe offers yet another example of a bearish engulfing pattern. At the top of a bullish trend, the market formed a bearish engulfing. Note that the second candlestick does not engulfs the previous candlestick’s lower shadow.
After the pattern’s formation, the market retraced over 50% into the pattern’s territory. That is the entry place for a short trade, and the invalidation level is the highest point in the bearish engulfing formation.
The risk-reward ratio is set in a similar manner, and, once again, it exceeds the 1:3 ratio explained earlier. It shows how powerful the Japanese candlesticks are in generating impressive risk-reward ratios.
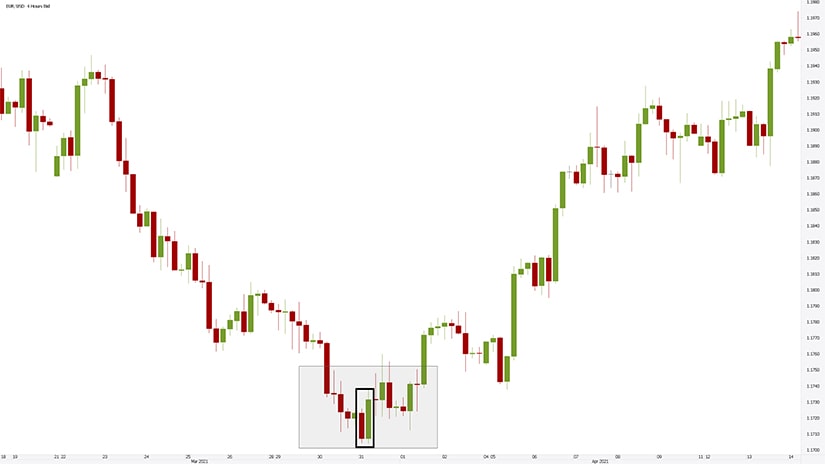
Example of a Fake Engulfing Pattern
 Perhaps the example below is not the perfect one to illustrate a fake engulfing pattern, because the market did bounce from the lows. However, the rules of a bullish engulfing are not respected.
Most notably, the second candlestick in the bullish engulfing pattern also engulfed the previous candlestick’s upper shadow. Hence traders should skip the pattern.
This simple rule is the one that filters most of the engulfing patterns. A quick check on different markets and timeframes will reveal that the correct engulfing pattern does not form that often. However, when it forms, and especially when it respects all the rules listed here, it rarely fails.
One of the biggest advantages of the engulfing pattern is that it can be traded using pending orders. Therefore, if the trader “scans” the bigger timeframes, say, the daily timeframe, in search for such patterns, after the second candlestick closes, the trader may place a pending order to enter the market at the 38.2% retracement level.
This way, there is no need to spend useless time in front of the screen when the markets do not move. In general, patterns that offer the possibility of using pending orders are considered more valuable than others.