
Hello there, this is tradingpedia.com and this video continues the zigzag series started a bit earlier because it is important to add continuation to the Elliott Wave Theory to understand various concepts.
This time we are dealing with the types of zigzag. Don’t be scared, there are not so many of them, only three exist, and one is already in front of our eyes.
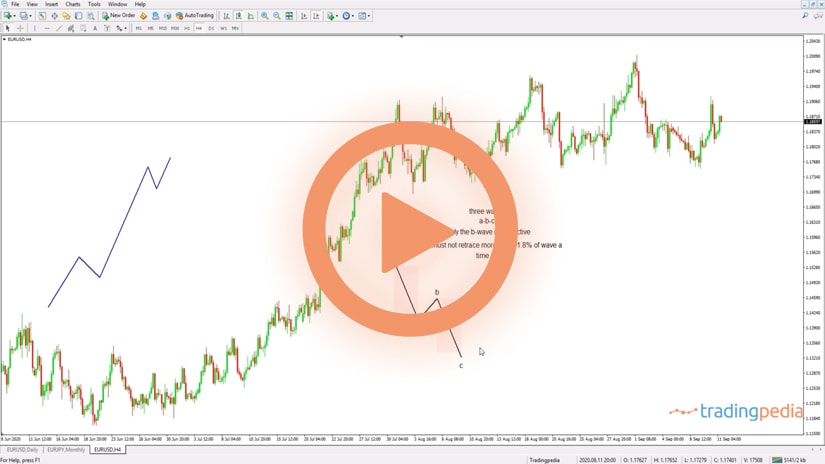
Normal Zigzag Pattern
This is called a normal zigzag, a pattern that forms most often. The type of the zigzag is given by the length of the c-wave. Also, the minimum distance for the c-wave to travel in any zigzag is the b-wave. You cannot have a c-wave shorter than the b-wave.
But a normal zigzag has a length between 61.8% and 161.8% of wave a. It means that we need to take a Fibonacci tool and measure the length of the a-wave and find out the 61.8% level and to project it from the b-wave’s end.
If we use the same tool to find out 161.8%, this is it. In other words, the boundaries for a normal zigzag are 61.8% of wave a or 161.8% of wave a. If the c-wave ends anywhere between the two levels, this is a normal zigzag.
But the time rule must be respected. Not like this, but either like this or it ends here. That would be a proper way to respect the time element.
Truncated Zigzag Pattern
Another possibility is that the market forms a c-wave that is shorter than 61.8% of wave a – a pattern called a truncated zigzag. In such a zigzag, the c-wave fails to extend more than 61.8% of wave a. A truncated zigzag is an important pattern because the price action that follows retraces minimum 80% and often 100% of the entire pattern.
Elongated Zigzag Pattern
The third type of zigzag is called an elongated zigzag and it forms when the length of the c-wave exceeds 161.8% of wave a. This is an elongated zigzag and the pattern appears in contracting triangles, either as the entire leg of a contracting triangle, or only as part of a leg of a contracting triangle. An elongated flat also appears in terminal impulsive waves but not that often.
So, if we have this wave a as an impulsive wave, then we want to measure its length with a Fibonacci tool to find out the 38.2% level. Usually the market retraces to the 23.6% -38.2% in the b-wave of a zigzag. The next thing we want to see is the market to make a new high when compared with wave a. This is the signal that the market started the impulsive wave as the last segment of a zigzag.
Next, we measure the time it took wave a to form and project it from the end of the b-wave. We also measure 61.8% of wave a, to find out what type of zigzag the market forms. We know that the five-wave structure cannot end here, this is incorrect, because the time is not respected. Instead, this should be the 4th and this the 5th and this is an impulsive wave, ending in a proper place with the c-wave.
Related Videos
Conclusion
If the c-wave extends 61.8%, it is a normal zigzag. If the c-wave ends beyond the 61.8% level, but below 161.8% of wave a, the market forms a normal zigzag. Finally, if the c-wave ends beyond 161.8% of wave a, think of a triangle, because the market formed an elongated zigzag, common in triangular patterns.
This is how beautiful the Elliott Waves Theory is. Bye, bye.