Trading using the slow stochastic oscillator
You will learn about the following
- Slow stochastic oscillator
- Trading strategies based on the slow stochastic oscillator
In this article, we outline two trading strategies used in stock trading; the first can also be applied to the forex market. Both strategies use only the slow stochastic oscillator.
The first strategy is based on multiple time-frame analysis. First, determine the general trend on the 1-hour chart. This strategy works only if the market has made a higher high or a lower low in the past couple of hours. Once the larger trend has been identified, enter positions only in that direction.
Next, move down to the five-minute time frame and use a 12-period slow stochastic. A buy signal is generated when the faster line, %K, moves into the oversold area (20-30) and then turns higher. Conversely, a sell signal occurs when the fast line moves into the overbought area (70-80) and then turns lower.
The stop-loss order should be placed beyond the recent trading range or the opposing swing high/low. If the market moves in the desired direction by the amount risked, move the stop-loss to break-even.
- Trade Forex
- Trade Crypto
- Trade Stocks
- Regulation: NFA
- Leverage: Day Margin
- Min Deposit: $100
Stop-loss and profit target
 Exit the position and take profit when the fast line reaches the opposite extreme (transitions from overbought to oversold, or vice versa), reverses and leaves that area. You can also exit on divergences between the 1-minute stochastic and the prevailing trend. If the market moves so strongly that the profit target is hit almost immediately, it is prudent to take the profit at once, as climactic moves are often followed by a reversal or a trading range. In addition, if the strategy produces two consecutive losing trades in a single day, stop trading and resume the next day. See the following example.
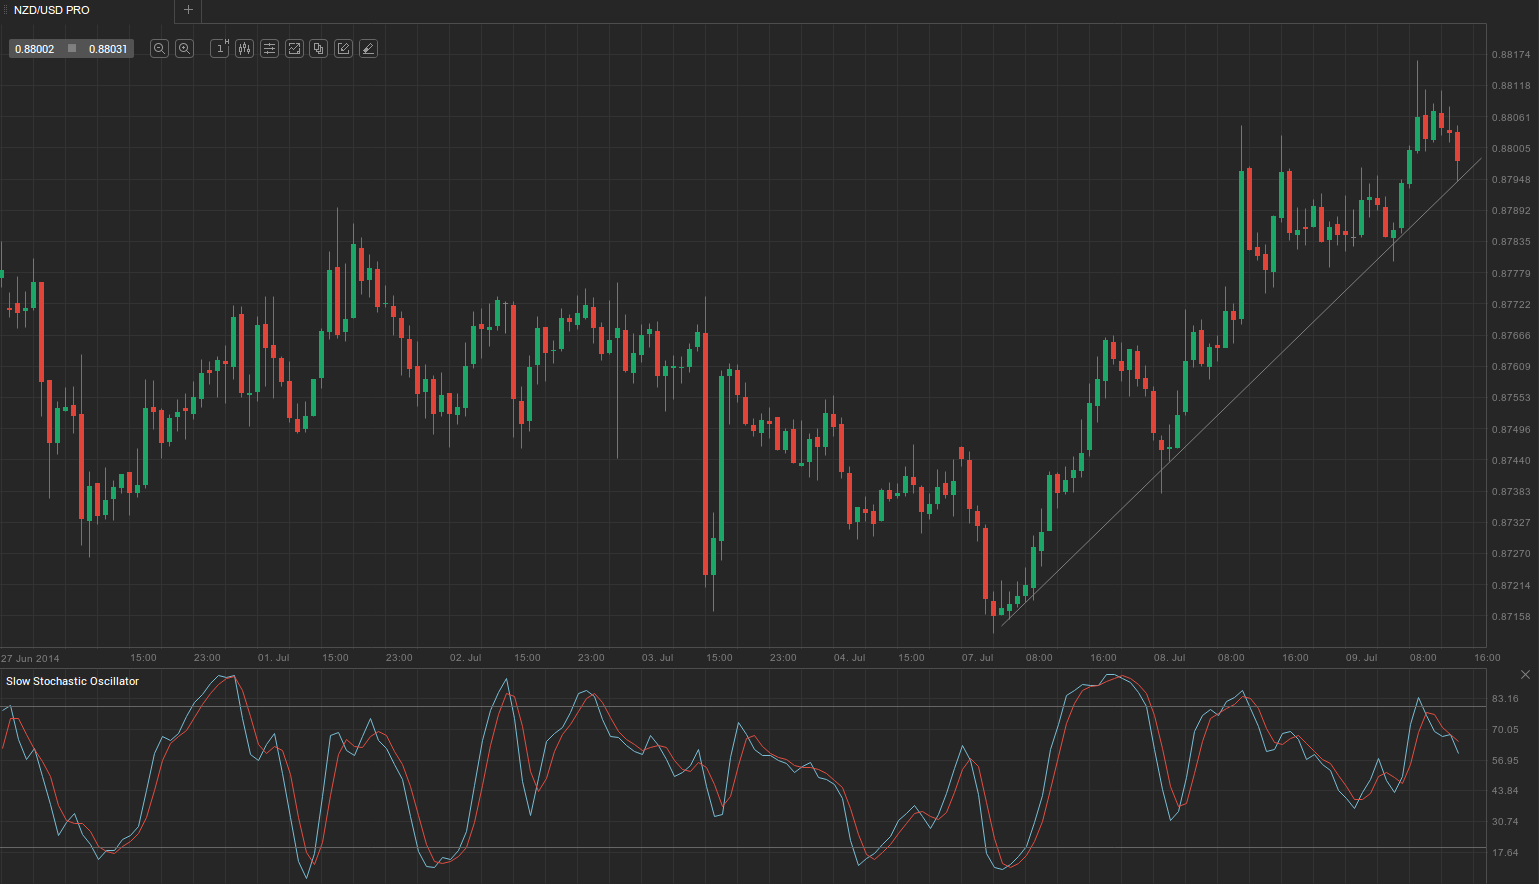
In the example above, the market has been in a decisive and pronounced bull trend for more than 50 bars, so we limit our entries to long positions only. Next, we move to the 5-minute time frame to refine our entry point, stop-loss and profit target.
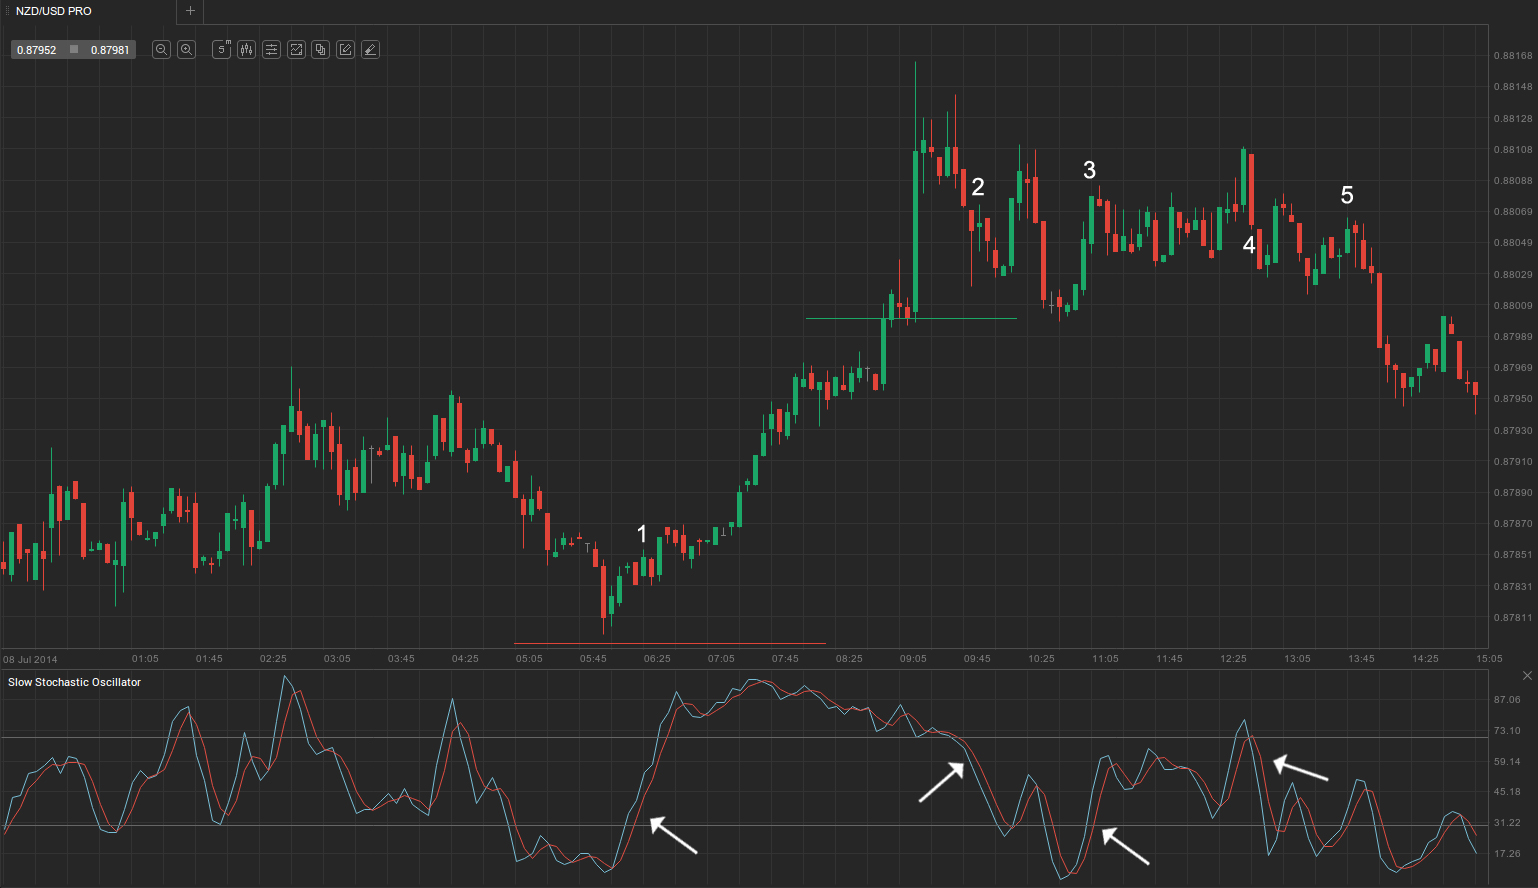
The second screenshot shows several suitable long entry signals. First, the slow stochastic reversed in the oversold area and moved higher at bar 1, so we enter long above its high at 0.8785. The stop-loss is placed 5-10 pips below the most recent swing low, marked by the red horizontal line, at 0.8770 US dollars. The risk is therefore 15 pips. As soon as the price rises 15 pips above the entry point, the stop must be moved to break-even. This occurs at 0.8800, indicated by the green horizontal line.
Upon reaching that level, we can either keep the entire position open or close half and leave the remainder to run. In either case, the stop must be trailed to break-even. The trade is eventually closed at the close of bar 2, where the slow stochastic leaves the overbought area.
Bar 3 provides another entry opportunity as the slow stochastic bottoms and rebounds above the oversold area. We go long at the close of bar 3. However, the market then enters a trading range, and a two-bar reversal ending with bar 4 changes the direction. The subsequent sell-off hits our stop-loss, turning the trade into a loser. A further entry signal appears at bar 5, but this too fails and triggers the stop-loss. Nevertheless, the initial winning position offsets the two later losses.
Second strategy
 The second strategy is best suited to trading stocks. It is applied on the 1-minute chart in conjunction with a 21-period slow stochastic. Crucially, it is used only during the first trading hour of the day. For further optimisation, trades should be taken only in the direction indicated by the 14-period stochastic on the 30-minute chart. If the faster line (%K) is above the slower line (%D), bullish momentum is present and you should take only long entries on the 1-minute chart, and vice versa.
After the market opens, look for a point where both stochastic lines are in the overbought or oversold areas and then cross. This crossing signals that the price is likely to reverse, and you should enter a trade provided it is in line with the higher-time-frame trend. Place the stop-loss at the previous higher low for a long position or the previous lower high for a short position (ideally a few pips beyond these levels to avoid noise). Avoid using the current day’s high or low as the stop-loss level. As the market moves in the desired direction, trail the stop to the next swing high or low.
There is no fixed profit target. Keep the trade open until either the trailing stop is hit or just before the market closes.