Forex trading strategy – combining exponential moving averages and the Relative Strength Index
You will learn about the following concepts
- Indicators used with this strategy
- Signals to look for
- Entry point
- Stop-loss
- Profit target
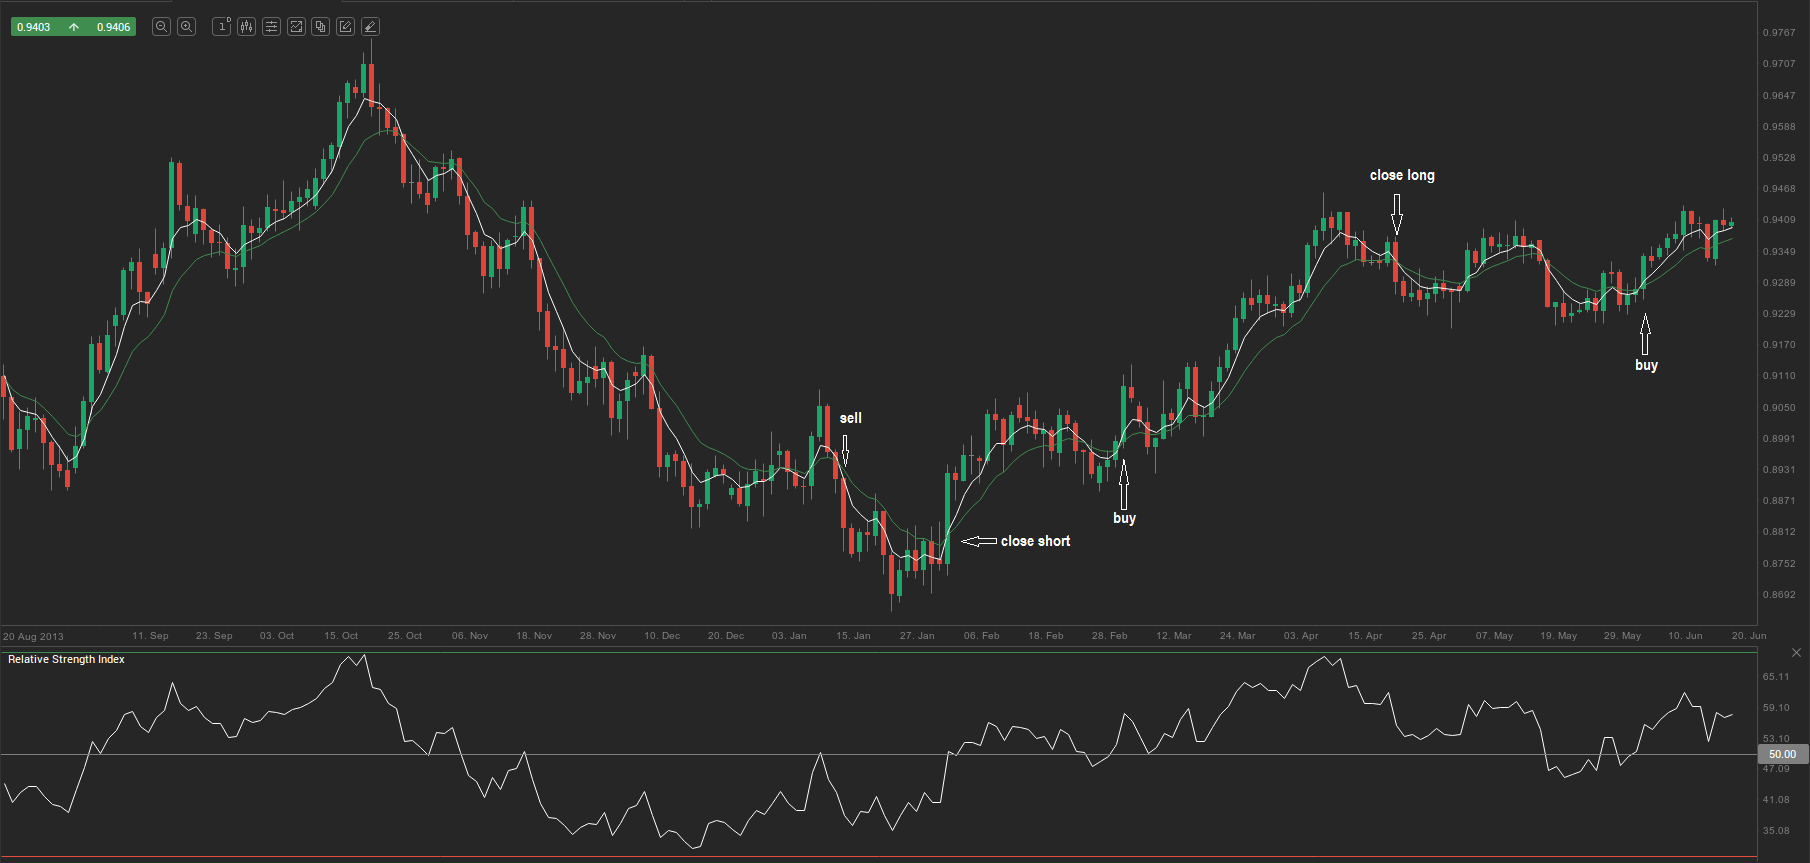
Traders who do not have much time to examine price charts may find this simple strategy attractive. The strategy uses a 1-day time frame and the following indicators: a 5-period Exponential Moving Average (EMA), a 12-period EMA, and the Relative Strength Index (RSI) with its period set to 21. This approach can be applied to any currency pair. For illustration, we use AUD/USD.
A trader will usually look for a long entry when the 5-period EMA (white on the chart below) crosses the 12-period EMA (green) from below, while the RSI is above 50.00.
A trader will usually look for a short entry when the 5-period EMA crosses the 12-period EMA from above, while the RSI is below 50.00.
- Trade Forex
- Trade Crypto
- Trade Stocks
- Regulation: NFA
- Leverage: Day Margin
- Min Deposit: $100
A trader will usually look to close the position when the two exponential moving averages cross again or when the RSI moves back through 50.00.
Below we provide examples of both a long and a short trade based on this strategy.