Combining the Slow Stochastic and the Relative Strength Index
You will learn about the following concepts
- Indicators used in this strategy
- Signals to look for
- Entry point
- Stop-loss
- Profit target
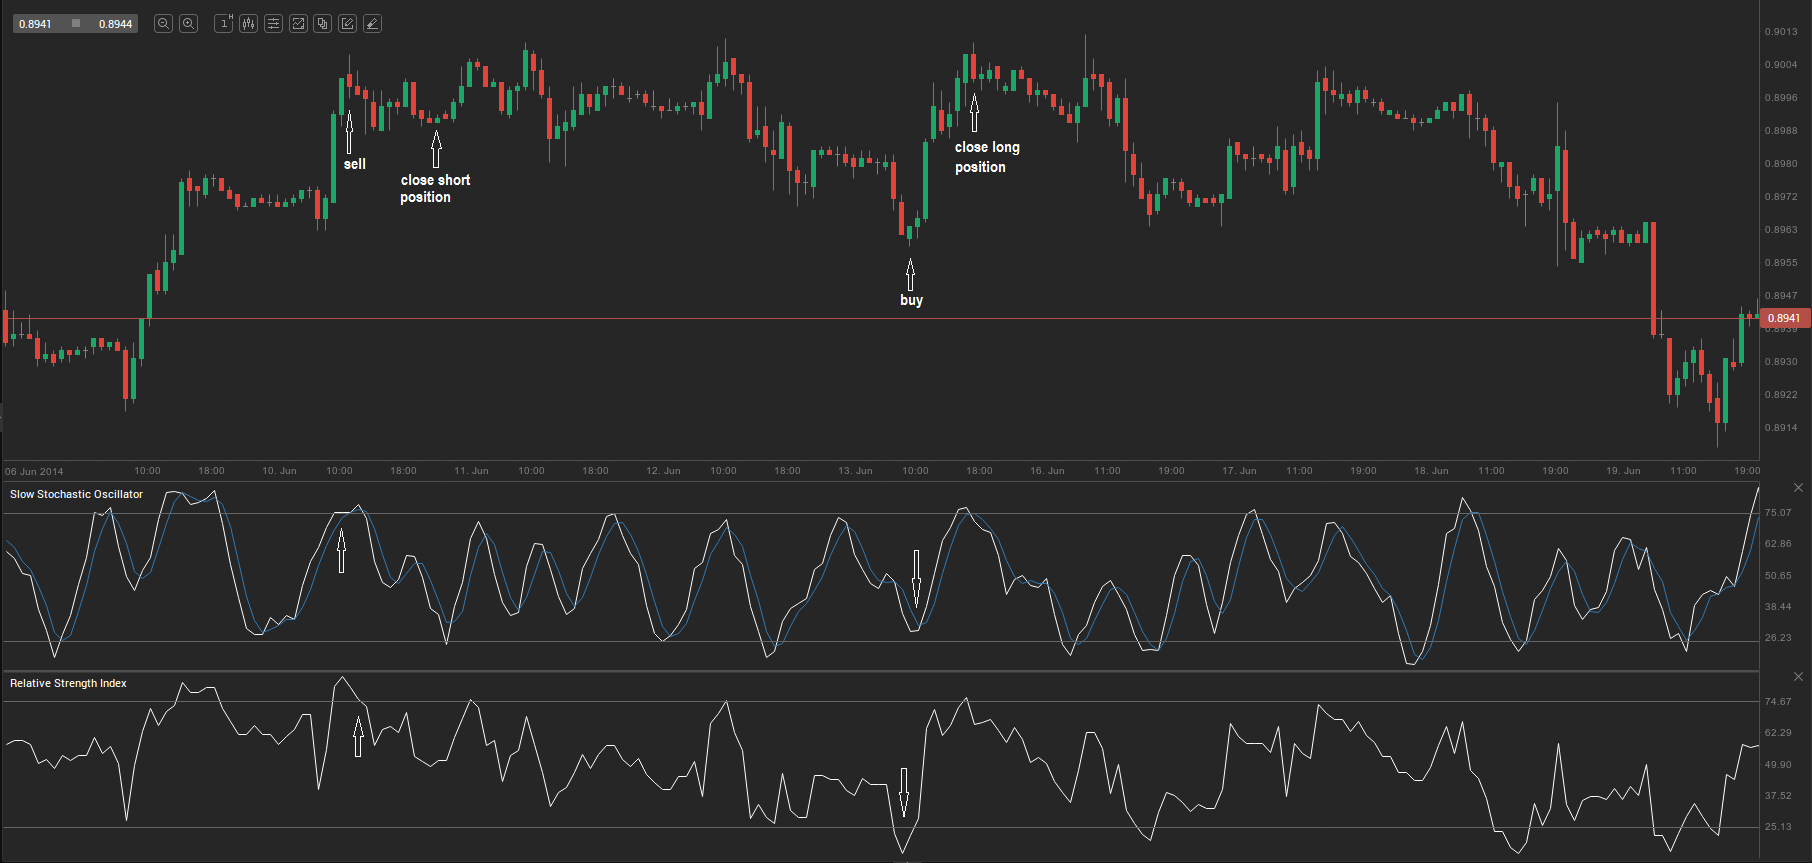
For this strategy, we will examine the 1-hour chart of USD/CHF. The indicators we will use are the Slow Stochastic Oscillator with settings (5,3,3; Slow K – white; Slow D – blue; overbought – 75.00; oversold – 25.00), the Relative Strength Index with settings (period – 7; overbought – 75.00; oversold – 25.00), and candlestick setups. The objective is to detect potential breakouts.
A trader will typically look for a long entry when both the Slow Stochastic and the RSI are oversold or close to the oversold level (25.00), and an uptrend candle (green on the chart below) has closed at the midpoint of the preceding downtrend candle (red on the chart below).
A trader will typically look for a short entry when both the Slow Stochastic and the RSI are overbought or close to the overbought level (75.00), and a downtrend candle has closed at the midpoint of the preceding uptrend candle.
- Trade Forex
- Trade Crypto
- Trade Stocks
- Regulation: NFA
- Leverage: Day Margin
- Min Deposit: $100
A trader will usually look to exit a short position when the Slow Stochastic and the RSI are oversold and an uptrend candle appears, closing at the midpoint of the preceding downtrend candle. The trader may then immediately reverse into a long position.
The opposite applies to closing a long trade.
Below we illustrate one long and one short trade, using the trading approach described above.