Trading Forex using fractals
This lesson will cover the following
- What are fractals?
- What do they tell us?
- How can we trade based on fractals?
The current article will acquaint you with a very reliable trading strategy based on the fractals indicator, whose role is to help predict potential price reversals. Each fractal is plotted as a small triangle or arrow above or beneath the bars, so you can have an ‘up’ fractal or a ‘down’ fractal.
However, despite this trading system’s satisfactory performance, as we know, nothing in Forex is risk-free and each indicator can produce a false signal. In our case, a broken fractal indicates that the price might continue to move in the same direction. A fractal can be broken by either the body or the shadow of a bar that forms later. Also, it is very important to know that a fractal is confirmed as valid only if two bars form and close after it; otherwise, it could disappear.
For this strategy, we will be using the concept of multiple-time-frame analysis, which is based on determining the general trend on a higher time frame and then dropping to a smaller chart to find the best possible entry points.
In our case, we choose to determine the larger trend on the 1-hour time frame. Based on fractals, the trend’s direction depends on which type of fractal (up or down) has been broken last. Keep in mind that it is not the arrow itself that needs to be broken, but rather the high or the low of the bar that is marked by it.
- Trade Forex
- Trade Crypto
- Trade Stocks
- Regulation: NFA
- Leverage: Day Margin
- Min Deposit: $100
Also, it does not matter whether the broken fractal is positioned before or after any opposite fractals – if an up fractal is before a down fractal but it gets broken and the down fractal remains intact, this indicates that the trend is up. Check out the following screenshot.
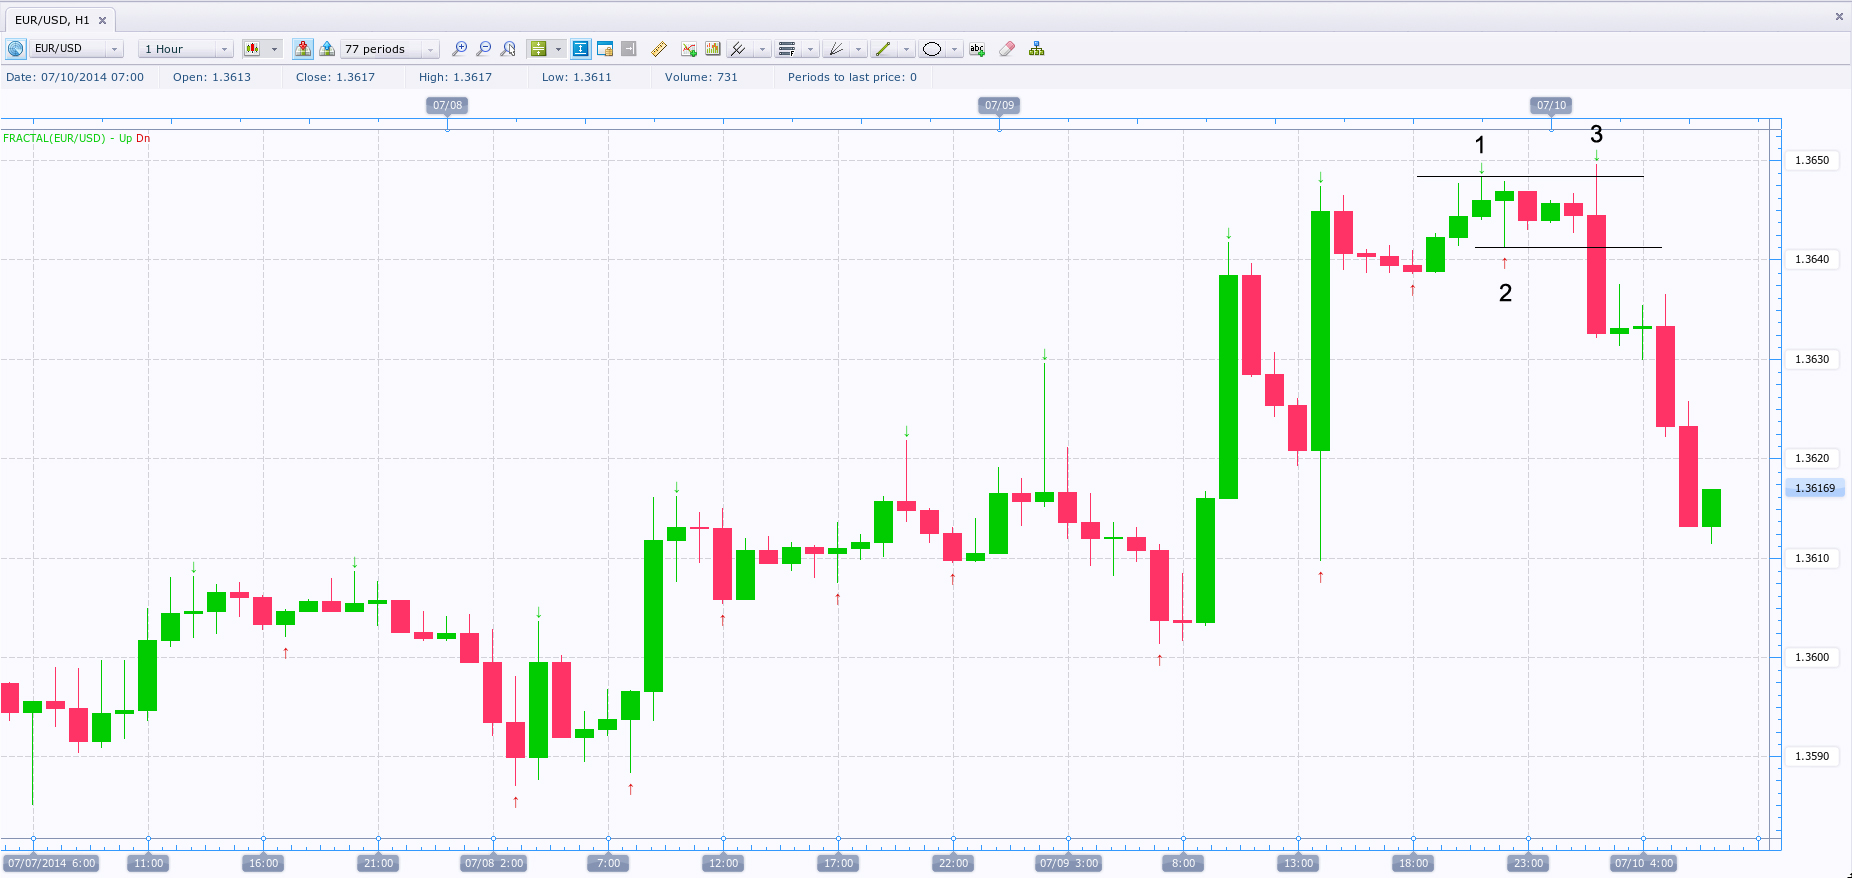
We have marked the last three fractals. The first fractal was up, the second was down and the third was up. However, as we said, the order of formation is not important; what matters is which fractal was broken last. As you can see, the fractal at bar 1 was broken first by bar 3, but the price then reversed and edged lower, breaking the down-fractal at bar 2. Because bar 2 was the last broken fractal, it implies that the market is headed downwards.
Pinpointing entry points using lower time frames
 Having determined the general trend on the higher time frame, you should now switch to a lower time window to receive more accurate entry signals – we will use the 15-minute chart. We already know from previous articles that the best place to enter in the direction of the trend is at the end of a pullback. Having learned from the 1-hour time frame that the market is moving down, when we drop to the 15-minute time frame we should wait for the price to rise against the larger time-frame trend and then go short.
We need to wait for a 15-minute fractal to form in the opposite direction to the hourly trend and, as soon as it is broken, we can prepare to enter in the direction of the larger trend. Bear in mind that this could take some time and you need to keep track of the general market conditions. If they change (for example, if the hourly chart trend reverses up), you should adjust accordingly and switch your entry direction to bullish instead of bearish.
If the larger time-frame conditions do not change, we remain in waiting mode for a counter-trend fractal to form. Since we used a downtrend for our example, we need to wait for an up-fractal to form and to be broken. As soon as that happens, we may proceed with initiating a trade.
The market must be entered via a pending sell-stop order (in the direction of the general trend). Also, it is of utmost importance that no major economic news is released after you’ve placed your pending order, as this can stir the markets and render the trade unsuccessful. If you are already in position, you should close it before the data is released.
The entry point is at the low of the candle marked by the previous ‘down’ fractal, while the stop-loss order should be placed several pips above the up-fractal bar break – around the tip of the fractal itself. Your profit target should be the next pivot point beneath the entry level, or, if it is too close (less than 10 pips), the next pivot point. Since we are entering short, our profit targets would be the pivot support levels. See the example below.
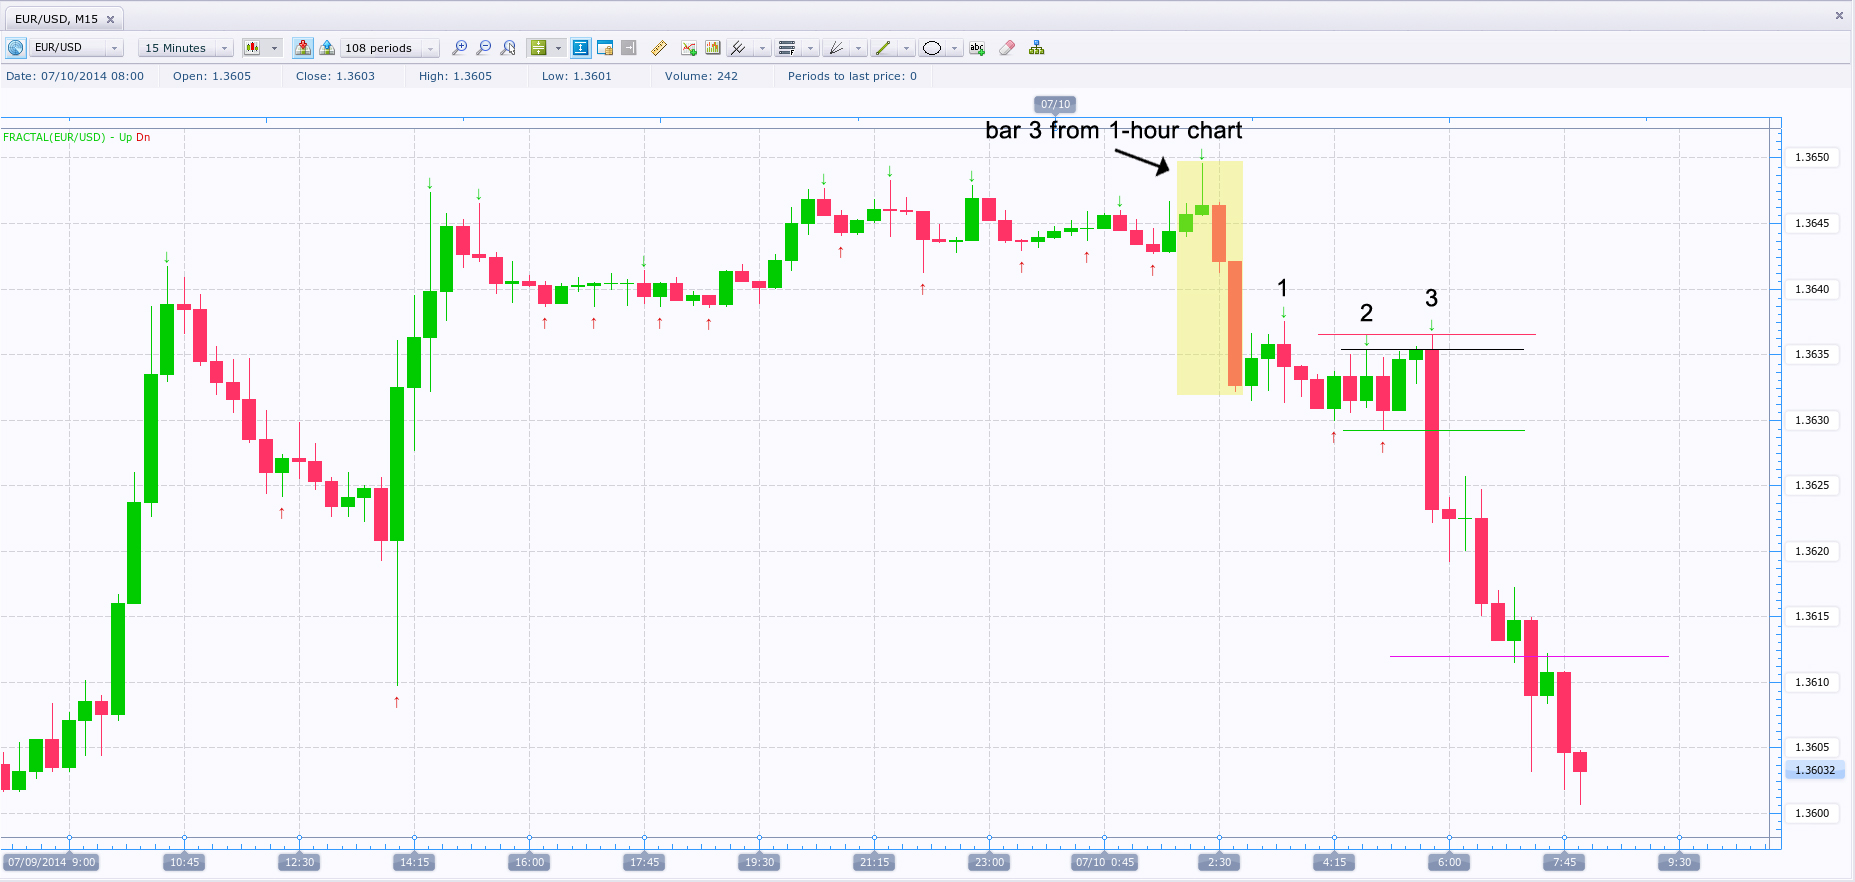
The yellow rectangle represents the 15-minute breakdown of bar 3 on the first screenshot. Once we have dropped down to the 15-minute chart and we know that the general trend direction is bearish, we want to wait for the break of an up-fractal. The first up-fractal was formed at bar 1, but it was not broken. A second up-fractal occurred at bar 2 and this time it was broken, at bar 3 at 1.3635, visualised by the black horizontal line.
Next, we proceed with placing our pending sell-stop order, stop-loss and profit target. We will need to enter at the low of the most recent down-fractal bar, as visualised by the green horizontal line at 1.3629. Our stop-loss is placed several pips above the high of the bar with the broken up-fractal (or just at the top of the fractal itself), marked with the red horizontal line at 1.3637.
To determine our profit target, we need to have calculated the day’s pivot points. Having done the maths, we find that the central pivot point is at 1.3629 dollars, while the closest pivot point is at 1.3612, as marked by the purple horizontal line.
Adjustments to the pending order
 Keep in mind that because the central pivot point for a given day is calculated on the basis of the previous day’s high, low and close, values will change at midnight. Thus, if you are holding a position open at that time, your profit target will need to be adjusted accordingly.
Because your sell-stop order is pending and it will take time to be filled, market conditions can change in the meantime, which will require certain actions.
First, if the larger time-frame trend changes, you will need to cancel the order.
Second, if a new ‘up’ fractal forms before the trade has been initiated, you will need to move your stop-loss order higher, above the tip of the newly formed up-fractal.
Also, if the price initially moves up, then moves back down and forms a new down-fractal before your initial pending order is triggered, you need to move the order to the low of the new down-fractal bar, even if it is above the old one.
Once your sell-stop order has been triggered and you enter the market, you need to trail your stop-loss as the price moves in your favour. The rule is to move your stop-loss to the tip of the next up-fractal that forms beneath the initial broken up-fractal. If a higher up-fractal forms, you should ignore it. Continue doing so until either your profit target is reached or the latest stop-loss has been hit and you exit the market.