On-balance volume – explanation and interpretation
You will learn about the following concepts
- What is on-balance volume?
- How can it be interpreted?
What is on-balance volume?
 On-balance volume (OBV) is a running total of volume and, as such, shows how volume can influence the price momentum of a given asset. OBV increases or decreases each trading day depending on whether the price closes higher or lower than it did the previous day. If a trading instrument closes higher, it implies that buyers have overcome sellers; the day’s volume is therefore added to OBV. If it closes lower, sellers have overcome buyers and that day’s volume is subtracted from OBV. If the instrument closes unchanged, OBV also remains unchanged. OBV is considered a leading indicator because it tends to change before the price does.
How can it be interpreted?
 A new peak in OBV indicates that buyers are strong and sellers weak, so the price of the instrument is likely to rise. A new trough indicates that sellers are strong and buyers weak, so the price is likely to fall. If OBV rises or falls in line with the price, the underlying trend is confirmed.
- Trade Forex
- Trade Crypto
- Trade Stocks
- Regulation: NFA
- Leverage: Day Margin
- Min Deposit: $100
If the price reaches a new peak and OBV registers a new peak, the bullish trend will probably continue. If the price hits a new trough and OBV makes a new trough, the bearish trend will probably continue. A trader will feel safer entering positions in the direction of a trend that is confirmed by OBV.
When OBV registers a new peak it indicates buyers’ strength and the price will probably rise further. Therefore, it can be used as a signal to open a long position.
When OBV falls to a new trough it indicates sellers’ strength and the price will probably decline further. Therefore, it can be used as a signal to open a short position.
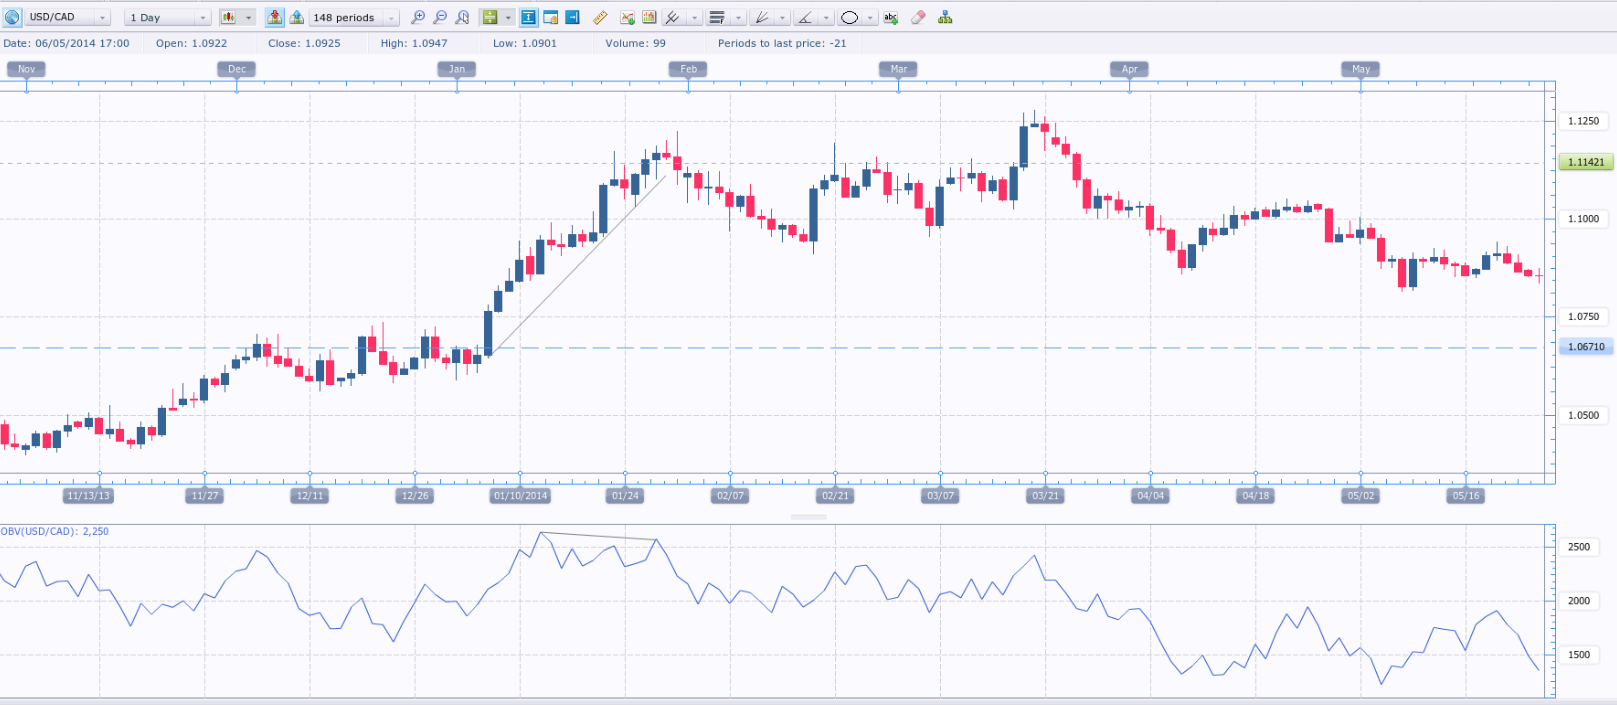
The most reliable buy and sell signals occur when OBV diverges from the price. If the price rises, then falls, and then rises again to a higher high while OBV forms a lower high, a bearish divergence is produced, providing a reliable signal to go short. Conversely, if the price falls, then rallies, and then falls again to a lower low while OBV forms a higher low, a bullish divergence is produced, signalling a long entry. Longer-term divergences are more reliable than shorter-term ones: patterns that develop over several weeks give more dependable signals than those that form over a few days. The daily chart of USD/CAD below shows a typical bearish divergence between price and OBV.
When the market is in a trading range and OBV surges to a new high, it can be considered a signal to go long. When the market is range-bound and OBV falls to a new low, it can be taken as a signal to go short.