
Hello there, this is tradingpedia.com and this video introduces one of the most interesting indicators that exist in technical analysis. This is a Japanese indicator, called Ichimoku Kinko Hyo, and you should not be intimidated by the name, as it is not that complicated.
Where You Can Find The Ichimoku Kinko Hyo Indicator
 As a matter of fact, a rough translation is “equilibrium at a glance”. It is offered by all trading platforms as a trend indicator, even though that is not necessarily true.
You can find in on the MT4 under Insert/Indicators/Trend. It is also called the Ichimoku cloud, or kumo. If you click on it, you will see three lines here – Senkou, Kinjun, Tenkan with 26, 9 and 52 periods. If you apply it on a chart, these are the elements that appear.
The Chinkou Line
 Why equilibrium? Focus on the current price. The EURUSD pair trades at 1.1723 at this point. Equilibrium means that the indicator already shows future values, but also has one element that refers to past values – the Chinkou line.
Elements
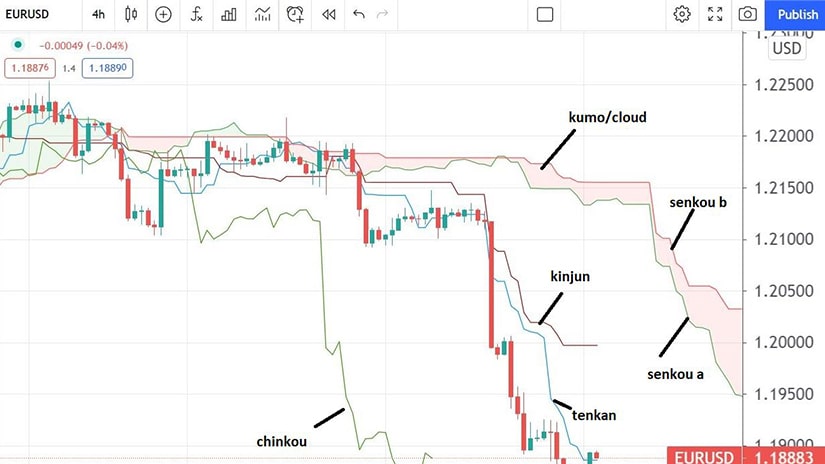
 The Ichimoku has five elements: the Chinkou, then this red line called Tenkan, the Kinjun (blue) and then this one called the kumo or the cloud. The cloud is made of two lines – Senkou A and Senkou B. When Senkou A crosses above Senkou B, that is called a bullish cloud. The opposite is a bearish cloud.
Equilibrium at a glance because the cloud is projected 26 periods ahead and this indicator does not repaint. What does it mean? It means that values will not change based on the future price action. Not the Ichimoku – all the values remain the same, will not change.
The trick when interpreting Ichimoku is to understand this equilibrium. If you try to look back at past prices, you should not consider the cloud below the candlestick, but the cloud 26 periods ahead.
Let’s edit the indicator, to change the Chinkou color – let’s use magenta. The Ichimoku has five elements – the cloud and three other lines.
Kinjun-Tenkan Crosses
 Various ways to trade with it exists. One way is to ride the trend. Namely, to trade the so-called Kinjun-Tenkan crosses. They signal short or long trades.
This cross, for instance, formed eight or nine days ago, and if you sell it here, when the cross happened, you will already have a profit. But this does not happen all the time. For example, we may have crosses that showed a bullish or bearish signal and the market did something else in the meantime.
Related Videos
The Cloud’s Color
 The color of the cloud plays an important role. Whenever you have a cross to buy or sell, consider the color of the cloud as a factor that reinforces the decision to buy or sell. For example, this is a bullish cross, and the cloud is bullish as well. Between taking this trade on the short side with a bullish cloud and this trade on the long side with a bullish cloud, we should favor the long one.
Another way to look at it is that the cloud offers support or resistance depending on the trend. But as you are about to find out, it is not necessarily true, but most likely the Chinkou will try to avoid obstacles.
Trading with the Ichimoku Cloud
 A rough translation for the Ichimoku Kinko Hyo is “equilibrium at a glance”. Effectively, it means that the current market price is in equilibrium, somewhere between future and past levels.
The interpretation of the current market price, therefore, depends both on future and past levels. On the right side of the chart, we have the cloud or kumo.
The cloud is formed by two lines – Senkou A and Senkou B. After their intersections, the cloud changes the color. For example, when Seknou A crosses above Senkou B, the cloud turns green, or bullish. Conversely, when Senkou B crosses below Senkou A, the cloud turns red, or bearish.
One of the most important aspects when trading with the cloud is to understand that the indicator projects it on the right side of the chart. More precisely, the cloud is projected twenty-six periods on the right side of the actual price. In the example below, the cloud is bearish and projected twenty-six periods forward in time.
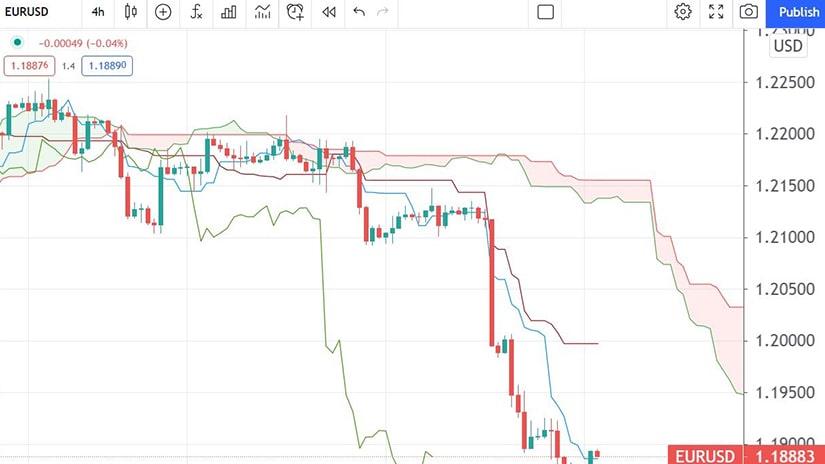
One way to use this information is to interpret the cloud as resistance when the actual price comes across. For the EURUSD pair to turn bullish, the price must cross through the cloud that acts as resistance.
The larger the timeframe, the stronger the resistance is. Also, the thicker the cloud, the stronger the resistance. Because the cloud is projected in advance, traders have an easier time setting the money management for a trade, or setting the entry level. For instance, one may decide to sell the EURUSD on a bounce higher, with a stop-loss order above the upper edge of the cloud and targeting a risk-reward ratio bigger than 1:2.
A Visual Guide of the Ichimoku Elements
 The cloud or the kumo is viewed by many traders as the most important element of the Ichimoku Kinko Hyo indicator. But the indicator is viewed as giving the best results when all its elements are interpreted together.
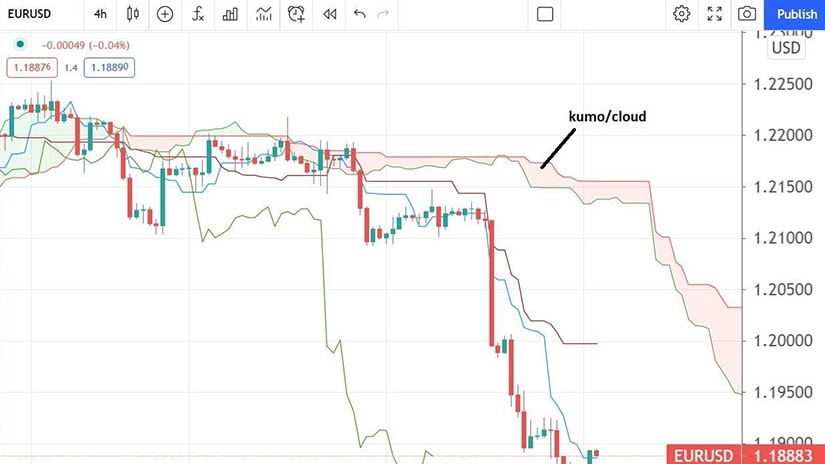
Here is a quick visual description of all the Ichimoku Kinko Hyo elements. As shown below, a bearish cloud is given by the Senkou A line moving below Senkou B.
When the market is trending, all the other Ichimoku elements are aligned, confirming the trend. In this case, the Tenkan line is below the Kinjun line, as it should be during a bearish trend. Remember that the Tenkan is just another form of a fast moving average while the Kinjun is a slower one. Therefore, their cross is highly regarded as showing possible market reversals.
Perhaps the most misunderstood element of the Ichimoku Kinko Hyo indicator is the Chinkou. This is the line that completes the state of equilibrium, always projected twenty-six periods behind the current market price.
The Chinkou line confirms the trending conditions by keeping a distance from the other Ichimoku elements as well as from the actual price. The closer the Chinkou comes to the actual candlesticks, the weaker the trend becomes.
More often than not, Chinkou reacts to all the other elements part of this indicator. For example, Chinkou has a strong tendency to be rejected the first time it reaches the candlesticks. Therefore, because the Chinkou is the current market price’s representation twenty-six periods before, the Chinkou’s rejection from the actual candlesticks corresponds to the current market price’s rejection.
Combining Kinjun/Tenkan Crosses with Kumo’s Color
 So far, we’ve presented one way to trade with the Ichimoku elements. That is, to sell against the upper edge of the cloud when the market is in a bearish trend.
Another way is to use the two averages, the Kinjun and Tenkan lines, and interpret their crossing. The two lines, if you want, act just as the regular SMAs that signal a bullish or a bearish market. For example, when the SMA(50) crosses above the SMA(200), the market forms a bullish or a golden cross. The opposite is a death cross, given by the SMA(50) moving below the SMA(200).
The same is with the Kinjun/Tenkan cross. When the fastest moving average crosses below the slowest one, a bearish cross or signal forms. Or, when it is moving above the fastest one, a bullish cross or signal forms.
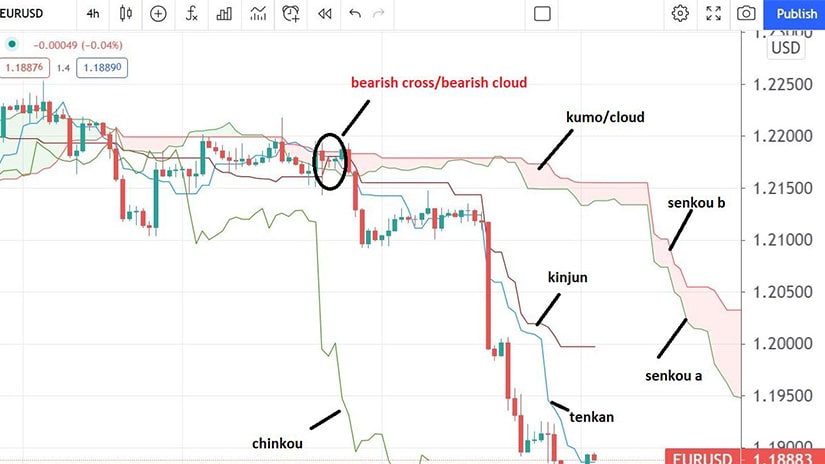
But using only the bullish or bearish crosses for a trade often leads to false signals. However, when used in combination with the cloud, results improve significantly.
In other words, on a bearish cross, make sure that the cloud is bearish too. More precisely, the cloud must have the color red at the same time when the Kinjun/Tenkan bearish cross forms.
Ideally, the setup would look like this. First, the price must be below or at the cloud. Second, the cloud must be bearish when the Tenkan line moves below the Kinjun line. Third, the Chinkou should meet some resistance given by one of the other Ichimoku elements.
How Does a Bullish Reversal Looks Like?
 We all know that the markets do reverse. How does a bullish reversal looks like and what needs to happen for the Ichimoku indicator to show bullish conditions?
The first thing that shows weakness in the bearish trend is the Chinkou’s ability to get closer to the candlesticks in front of it. If and when the Chinkou crosses through the candlesticks, it signals the first attempt of the market to reverse the bearish trend.
Even if the current market price breaks above the projected cloud, the reversal is incomplete until the Chinkou moves above the cloud too. Hence, one need to always check the Chinkou’s level twenty-six periods behind the current market price to have the confirmation for the bullish reversal.
Finally, once the Chinkou is above all the other Ichimoku elements and above the candlesticks, a bullish trend started. From that moment on, everything below represents support and the interpretation of the bullish trend is similar with the examples used in this article to document the bearish price action with the Ichimoku Kinko Hyo indicator.