
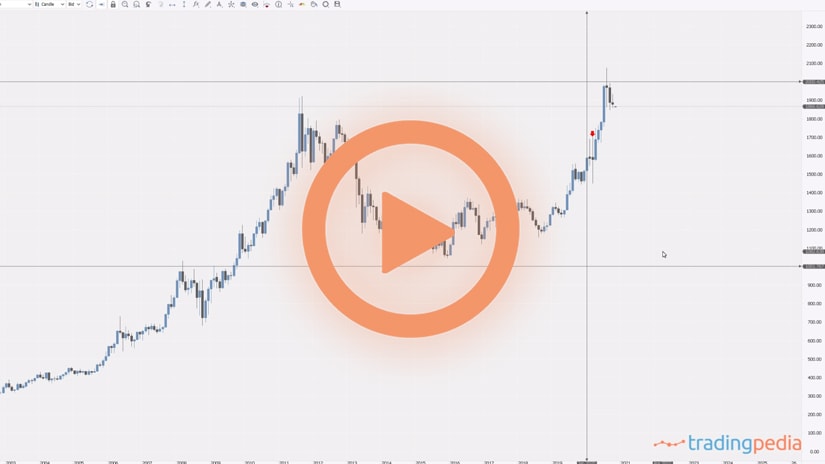
Hello there, this is tradingpedia.com and we continue our series on how to trade gold. We have previously explained the connection between gold as an investment and gold as a hedge against inflation and what happened here with the pandemic. This is the moment 2020 started and then when the pandemic reached the Western world.
Overview
Also, let’s mark the round numbers of $1,000 and $2,000. Round numbers are always important in technical analysis. Look at what the price of gold did when it first touched the $1,000 level coming from the lows. It hit the level and then corrected as it reached resistance. Next, the market formed an ascending triangle against the horizontal resistance. Even here, at the third attempt, it suggests an ascending triangle.
Moving forward, we said that the price of gold moving to the upside was triggered by the weak USD. That is true to some extent, because the EURUSD moved to 1.20 from 1.07. Also, the GBPUSD pair moved from 1.15 to 1.34 and so on.
How Gold Behaves During Financial Crises
But gold did something interesting. Let’s compare the current crisis to the one in 2008-2009. The triangle mentioned earlier formed during the financial crisis. The USD moved lower during that crisis too – but it did so only against gold. If you go on the EURUSD chart and check the 2008 levels, you will see all-time highs at 1.60 and after the crisis, the USD gained against other fiat currencies, but lost against gold.
Therefore, gold as a hedge against inflation works as well. However, gold also is used to obtain diversification benefits. More precisely, how can we explain the fact that gold broke higher in 2019? Why 2019 in the summer and why not here?
We see that the market was on a bearish trend here and then if we use a trendline like this one we see the neckline of an inversed head and shoulders pattern. This is the left shoulder, this is the head, and here the right shoulder. Next, the market broke higher, but the break came in 2019. However, from 2016 the price of gold consolidated on the right shoulder while forming a series of higher lows, putting pressure against the horizontal line. The same happened during 2008-2009 crisis.
This is the monthly chart and no trader use it to open positions. But if you use the picture you cannot end up on the short side with such a development for the last three to four years prior to the break higher and the pandemic.
Any trader familiar with technical analysis knows that a head and shoulders pattern has a measured move. If we project it from the neckline, it gives us the target reached during the pandemic, but it represents only the minimum distance the market should travel.
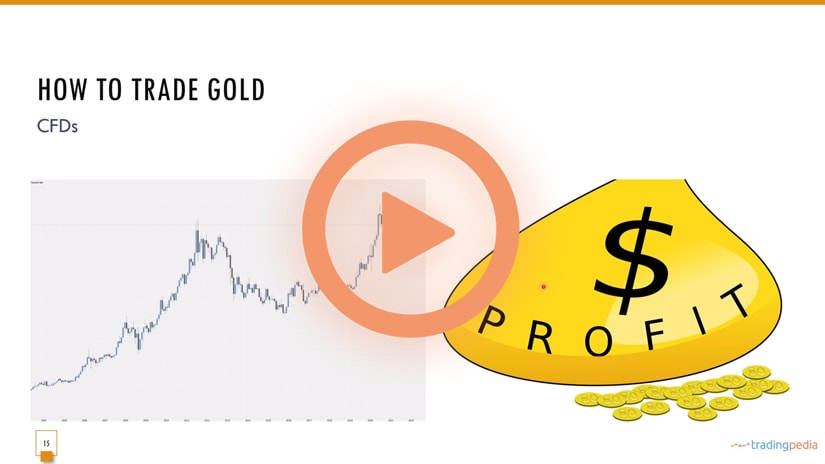
With this we end up this part on how to trade gold and we insisted on CFDs. The next part deals with gold on the MT4, as I want to cover the costs associated with trading gold on the MT4 platform and what it means to scalp the gold product using a CFD.
The trading platform used for the technical analysis doesn’t really matter – you can do your analysis using one trading platform and then do the trading on another.
Related Videos

Conclusion
To sum up, gold broke higher before the pandemic, after years of forming a reversal pattern. Therefore, bulls added gold to a portfolio not necessarily from a technical perspective, but to obtain diversification benefits. By the time gold broke higher, it became obvious to anyone.
Thank you, and let’s move on.