
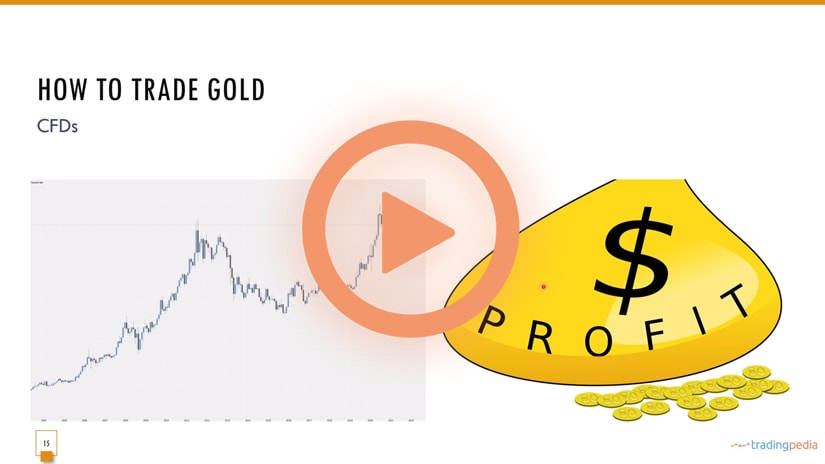
Hello there, this is tradingpedia.com and we continue our series dedicated to trading gold. On the previous video we covered how to trade a CFD.
Overview
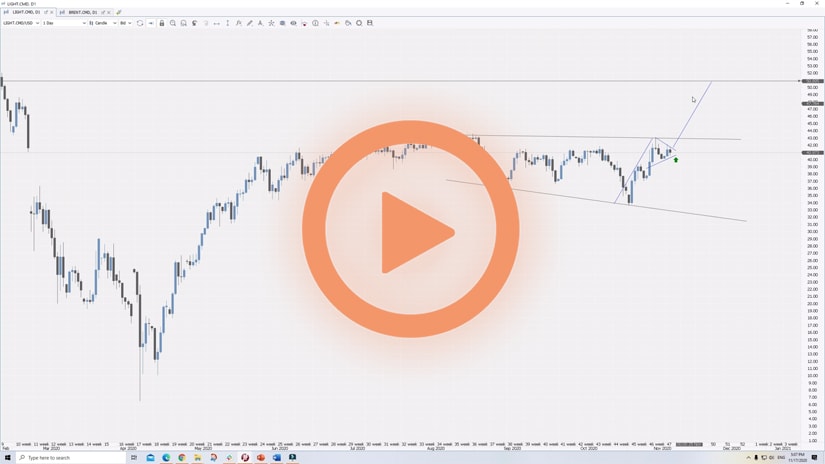
This is the XAUUSD, the monthly chart, and shows the price action on gold on this broker. We have data only from 1999. Here, I would like to point to the historical perspective. It does not mean that the price of gold did not fluctuate against the USD before 1999. Because of the Bretton Woods and the Nixon shock earlier, there must be something else on the left side of the chart.
Of course, if you trade only on the hourly chart and scalping, you don’t care about the bigger picture. But if you try to understand the purpose of gold in investing and in a portfolio, then you need access to old data.
As we saw in the previous videos, gold moved to the upside all the way to $1,900, failed there, returned to almost $1,000 and then it made a new high during the pandemic. This is one point I want to make regarding trading gold. The purpose here is to understand why gold has its place in the investment world.
Gold Market During the COVID-19 Pandemic
This is January 2020. Three months later, in March, the market collapsed due to the pandemic reaching the Western world. From that moment on, together with gold, stocks fell too. Why did the price of gold moved lower when it was supposed to be a hedge and act as a safe haven? Here, Dow Jones, Nasdaq, etc., they all triggered circuit breakers and collapsed. Many people called for shutting down the market because there is no precedent for the pandemic, and so on.
But the main reason why the markets collapsed was the lack of USD liquidity. The XAUUSD is an exchange rate that shows the value of gold in terms of USD. If you switch this chart and find XAU against some other currency that appreciated against the USD, the chart will look different.
Coming back to the liquidity issue in March, there were few dollars in the system. The USD is the world’s reserve currency, as central banks around the world prefer to keep their reserves is the USD (60%). The USD is here to stay – the second favored currency is the EUR, but it has only a third of the USD share in central banks’ reserves.
As such, the lack of USD liquidity triggered a higher USD. The EURUSD collapsed from 1.15 to 1.07. The GBPUSD fell to 1.15 – and gold lost ground too. And then the Fed stepped in by opening USD swap lines with other central banks around the world – lines that are still open to this day.
In other words, whoever needed USD, the Fed offered them, with the aim as minimizing the shock on the world’s economy. As a consequence, the stock market bottomed, and so did the gold market.
But we see here two different narratives. One is that gold moved higher with the stock market, meaning that it reacted to a weak USD. More precisely, to inflation fears. So this is a hedge against inflation.
Related Videos


Conclusion
However, there is another narrative on this chart too. What happened to gold prior to the pandemic? From 2013 to 2019, gold consolidated. It broke higher six months before the pandemic. So, what was this? We will discuss this in the next video – bye, bye.