
Hello there, this is tradingpedia.com here and we move on this video covers correlations between the gold market and other markets available to trade. We have mentioned so far, the correlations to consider, like gold and Bitcoin, gold and silver, gold and the Australian dollar, and son.
Overview
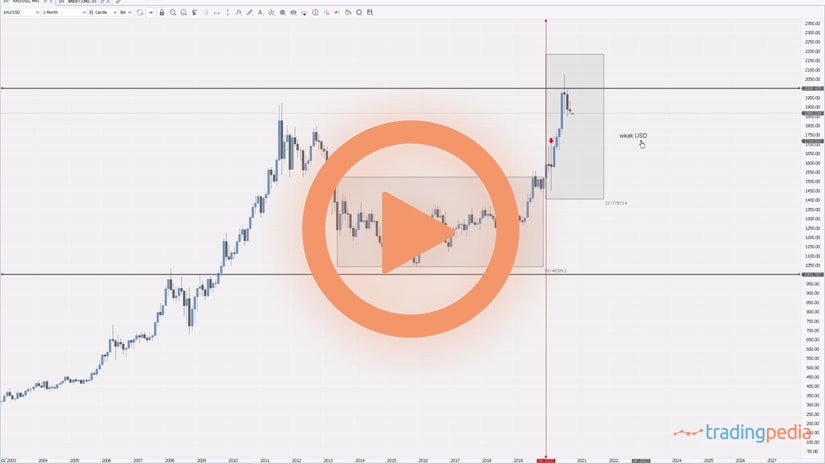
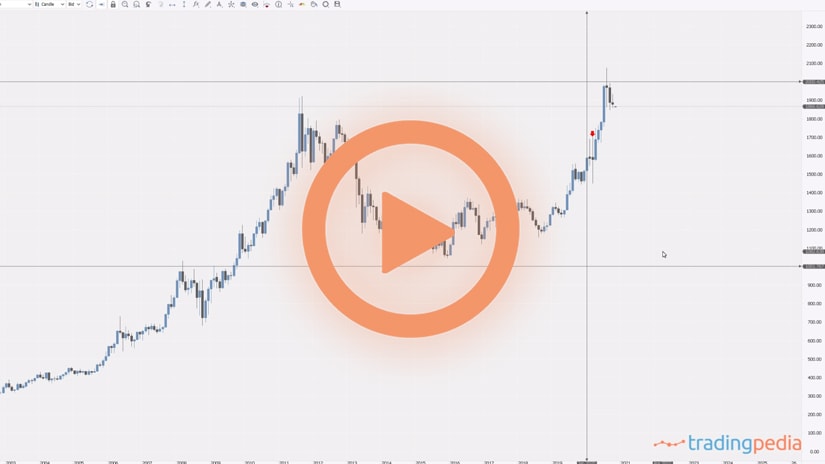
We will not discuss here about Bitcoin, but we will talk more about the silver and gold ratio as it exists for a long time and many traders pay attention to it when they open positions. This is the gold daily chart, and we see that it broke lower as the $1,850 gave way.
The series of lower highs remained in place and the price eventually broke lower. If this is a triangle as a reversal pattern, a-b-c-d-e, the break lower should lead to more weakness.
Price of Gold vs AUDUSD
However, let’s compare the price of gold with the AUDUSD pair. As mentioned here, Australia is a big gold producer. Therefore, there is a tight correlation between the price of gold and the AUDUSD. Look what happened on the daily chart with the two financial assets in 2020.
Gold moved to the upside, as it broke higher during the summer of 2019, and then, in March 2020, both gold and the AUDUSD fell. Because the Fed flooded the system with dollars, the price of gold recovered and quickly made a new high when compared to the previous one.
The AUDUSD bounced as well, mimicking the move in gold. Next, gold corrected on the horizontal, while the AUDUSD did so in a running triangle – imagine here an a-b-c-d-e.
We see now that the price of gold declined from the highs, while the AUDUSD pair keeps consolidating on the horizontal. If you are familiar with the price action on the FX market, this is what happened in the last several months – just a consolidation on the horizontal.
Is it possible that gold leads the way and keeps falling, and eventually the AUDUSD will fall too? Well, if gold keeps moving, this divergence cannot continue for a long time. Therefore, this is one correlation to consider.
Related Videos
Gold and Silver
Another correlation to consider is the one between gold and silver. On the chart, this is the daily performance on gold, and this is the daily performance on silver.
There is also a gold/silver ratio that tells the difference between the two financial assets. When gold leads and silver is far away from the gold price, then traders open positions on silver rather than gold, because it will travel more.
Check the dip in the price of gold during the coronavirus crisis and the dip in the price of silver. Silver lost much more. While gold recovered, silver outperformed and went all the way up here and those that bought it at the heist of the pandemic and held up to the highs, made a good trade.
The point here is that the same patterns that we see on gold, form on silver, only that the moves in silver are stronger. Consider this triangle – it shows how silver traveled more than gold on the breakout.
Therefore, the price of gold protects from increased volatility in the trading and this is something that matters for every trader. When thinking of the gold and silver correlation, consider how much silver distance itself from the actual price of gold. The bigger the distance between the two, the more traders will trade silver and not gold.
Gold leads the price in silver, but also in the AUDUSD. If this breakout is for real and if this triangle will reach its measured move, the AUDUSD cannot go much higher. Have a great day – bye, bye.