 Yesterday’s trade saw USD/JPY within the range of 119.78-121.22. The pair closed at 120.51, soaring 0.58% on a daily basis, while marking a third straight day of gains. The daily high has also been the highest level since September 1st, when the cross registered a high of 121.28.
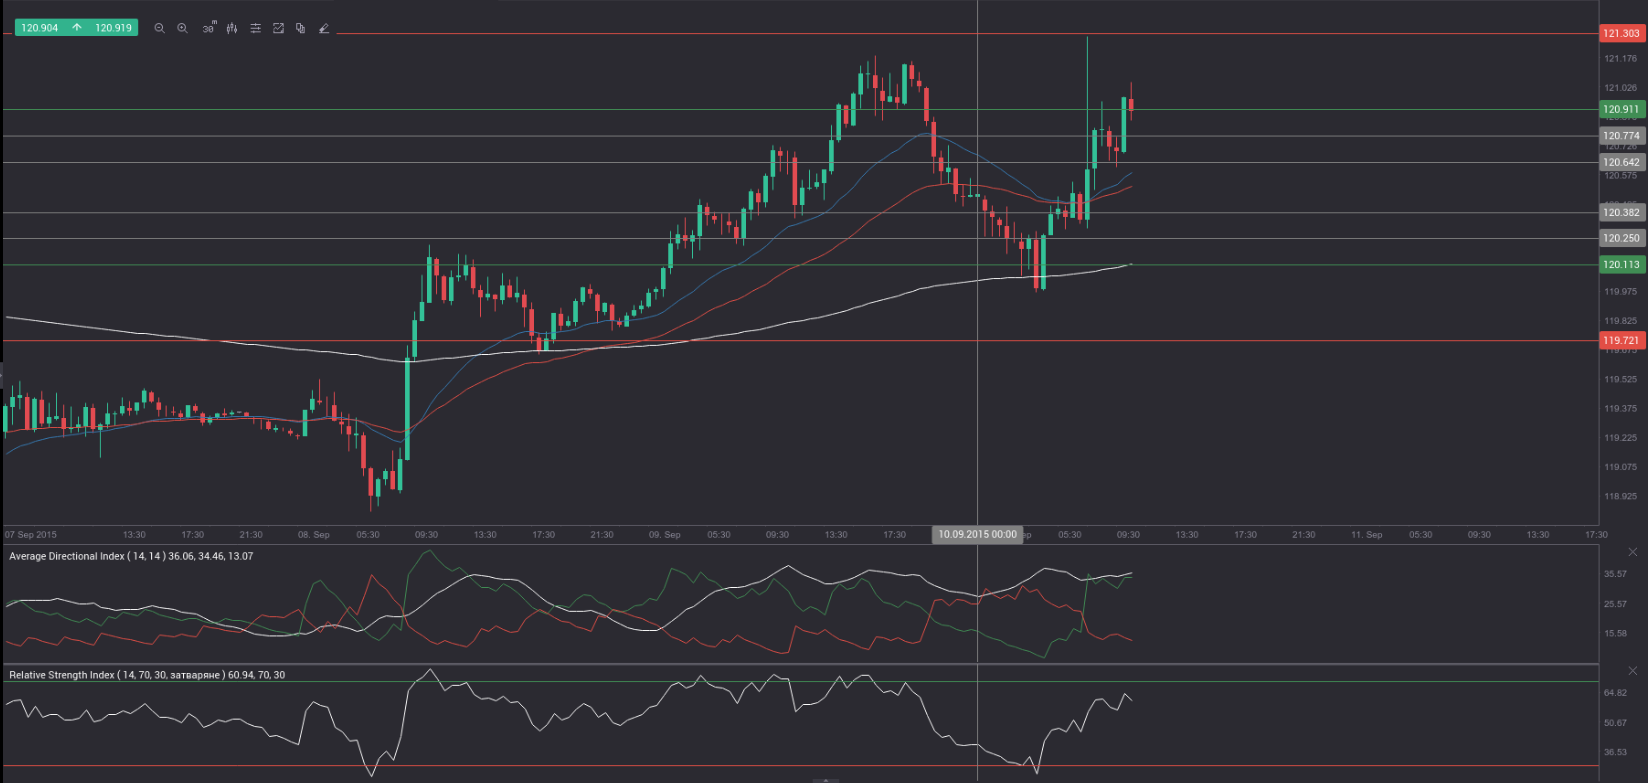
At 7:39 GMT today USD/JPY was up 0.38% for the day to trade at 120.98. The pair tested the upper range breakout level (R4), as it touched a daily high at 121.29 at 4:50 GMT. It has been the highest level since August 31st, when a daily high of 121.75 was reached.
Today the cross may be influenced by a number of macroeconomic reports as listed below.
Fundamentals
United States
Initial, Continuing Jobless Claims
The number of people in the United States, who filed for unemployment assistance for the first time during the business week ended on September 4th, probably fell to 275 000, according to market expectations, from 282 000 in the prior week. The latter has been the largest number of claims since the business week ended on July 3rd, when 297 000 claims were reported.
The 4-week moving average, an indicator lacking seasonal effects, was 275 500, marking an increase of 3 250 compared to the preceding weeks revised down average.
The business week, which ended on August 28th has been the 26th consecutive week, when jobless claims stood below the 300 000 threshold. This continues to support the case labor market conditions in the country follow the path of improvement.
Initial jobless claims number is a short-term indicator, reflecting lay-offs in the country. In case the number of claims met expectations or dropped further, this would have a moderate bullish effect on the US dollar.
The number of continuing jobless claims probably decreased to the seasonally adjusted 2 250 000 during the business week ended on August 28th from 2 257 000 in the prior week. The latter represented a decrease by 9 000 compared to the revised down number of claims, reported in the business week ended on August 15th. This indicator reflects the actual number of people unemployed and currently receiving unemployment benefits, who filed for unemployment assistance at least two weeks ago.
The Department of Labor is to release the weekly report at 12:30 GMT.
Bond Yield Spread
The yield on Japanese 2-year government bonds went as high as 0.019% on September 9th, after which it slid to 0.015% at the close to gain 0.001 percentage point on a daily basis.
The yield on US 2-year government bonds climbed as high as 0.765% on September 9th, or the highest level since June 17th (0.766%), after which it fell to 0.737% at the close to remain unchanged for the day.
The spread between 2-year US and 2-year Japanese bond yields, which reflects the flow of funds in a short term, shrank to 0.722% on September 9th from 0.723% during the prior day. The September 9th yield spread has been the lowest one since September 7th, when the difference was 0.702%.
Meanwhile, the yield on Japans 10-year government bonds soared as high as 0.372% on September 9th, after which it slid to 0.361% at the close to depreciate 0.009 percentage point compared to September 8th.
The yield on US 10-year government bonds climbed as high as 2.254% on September 9th, or the highest level since August 7th (2.254%), after which it slipped to 2.185% at the close to lose 0.001 percentage point on a daily basis. It has been the first drop in the past three trading days.
The spread between 10-year US and 10-year Japanese bond yields widened to 1.824% on September 9th from 1.816% during the prior day. The September 9th yield difference has been the largest one since August 31st, when the spread was 1.833%.
Daily and Weekly Pivot Levels
By employing the Camarilla calculation method, the daily pivot levels for USD/JPY are presented as follows:
R1 – 120.64
R2 – 120.77
R3 (range resistance – green on the 30-minute chart) – 120.91
R4 (range breakout – red on the 30-minute chart) – 121.30
S1 – 120.38
S2 – 120.25
S3 (range support – green on the 30-minute chart) – 120.11
S4 (range breakout – red on the 30-minute chart) – 119.72
By using the traditional method of calculation, the weekly pivot levels for USD/JPY are presented as follows:
Central Pivot Point – 119.83
R1 – 120.92
R2 – 122.83
R3 – 123.92
S1 – 117.92
S2 – 116.83
S3 – 114.92