
Gold has been trading in a downtrend since August 2020. We have several points of evidence which suggest this downtrend may continue.
Japanese Candlestick Analysis
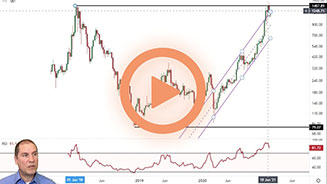
First, looking at the daily chart we can see several bearish candlestick formations taking place.
Starting with December 21, 2020, a spinning top formation appears. This type of formation indicates indecision. In this instance, the uptrend is getting tired and the formation is giving us a clue to that.
Secondly an evening star candlestick formation is a 3-candle pattern. It appears from Jan 4-6. This is a bearish candlestick formation and commonly leads to additional losses. Considering this formation carved near the November 9 high is a big clue that this market is weak and wanting to move lower.
Next, we have a bearish long wick to the upside on January 29. The long upper wick tells us that price traded up to those lofty levels temporarily, but then were immediately pushed back down. In essence, the sellers are stronger than the buyers so this is another bearish formation.
Lastly, we have a bearish engulfing candlestick pattern. This is a two-candle pattern where the second candle opens higher than the previous day, but then closes strongly lower “engulfing” the previous candlestick.
Each pattern by itself is a clue of a weak gold market. When you package all of these signals together, it paints a picture of a gold market that is wanting to move drastically lower.
In the video above Jeremy mentions joining the Trading Price Newsletter. By adding your email address to the recipient list, I’ll immediately send you a special report on why traders tend to underperform. The report will illustrate how a good strategy can still lose. Additionally, by becoming a Trading Price Insider, you will receive education and analysis twice per week via email plus any alerts to new courses and webinars.
Gold is working on its largest correction in nearly 5 years
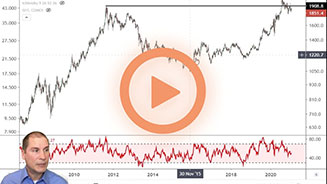
On February 19, 2021, gold price reached their lowest level in 8 months. However, when you consider the depth of the correction in gold from the August 2020 high, this current trend lower is becoming one of the largest since 2016!
From the August 2020 high to the February 2021 low, gold prices have corrected lower by about 18%.
Previous corrections from March 2020 and 2018 were slightly smaller at nearly 15%.
As a result, you have to go back to 2016 to find the next largest correction which was 18%.
Related Videos

Gold prices are resting on support
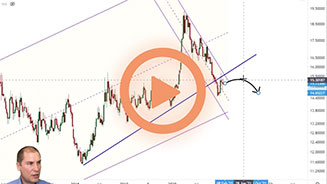
The gold price chart shows a level of horizontal support crossing near the current price level. If gold continues lower, this breakdown through support may accelerate losses for the yellow metal. A similar breakdown in silver prices may occur simultaneously.
This means that the current correction is a different bird from a different feather. The breakdown through may work down to the next level $1690. If the $1690 support level breaks, then gold prices may drop down to the 38.2% Fibonacci retracement level near $1600. From there, continued losses may push lower to the next level of Fibonacci support near $1350.
Establish a game plan for trading because learning to trade does not to cost a blown account. Join the Trading Price Newsletter and receive trading tips for expert trader and chart reader Jeremy Wagner.