Hello, this is TradingPedia.com, and welcome to this video on precious metals. As we turn the calendar to a new year, let’s go out and take a look at what might be in store for gold and silver over the course of 2021. Let’s dig into the charts.
Gold and Silver Charts
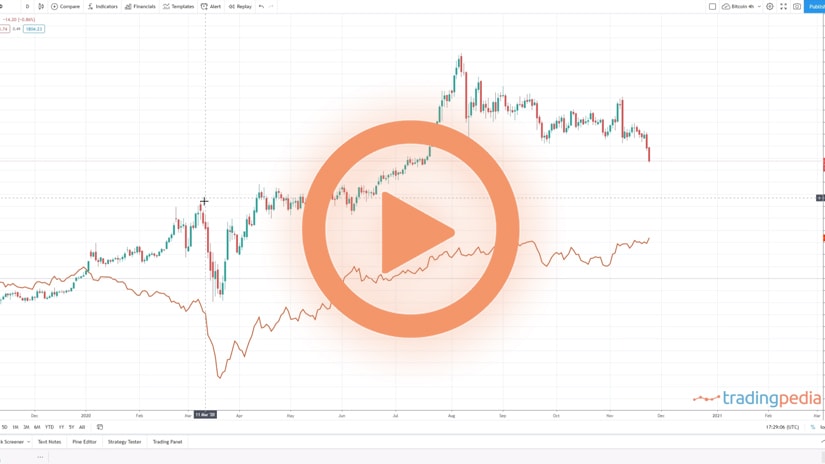
The first chart that we’re taking a look at is gold in black, overlaid with the price of silver in orange. One thing that stands out to me is that we have a divergence between the recent swing high in gold and an inability for silver to reach its similar swing high. So let me unpack this for you.
Let’s go out here and let’s add this horizontal ray. So if we go up here to this previous high in silver, you’ll see that is up where this line is and the current pricing is well below where the high was that we saw over 10 years ago.
Now, if we come out and if we do a similar thing for gold, the high that we saw back in 2011 for gold was about right here where this black line is. And clearly, in the year 2020, gold pushed up to a brand new all-time high, whereas silver was well below reaching that same all-time high mark.
And that’s important because many times during significant market turns, you’ll see similar markets move in the opposite direction or not confirm one another. And a saying that I like to use is “Birds of a feather tend to flock together”.
And so here you’ve got two precious metals, gold and silver, and they should be making new all-time highs together. They should be making new lows together. And in this case, gold made the new all-time high. Silver did not. So by itself, it suggests that there is going to be some limited upside, at least for the near term.
Now in isolation, that’s how we can take a look at it. I don’t know if that’s exactly how it will play out over the long run. Over time, it’s possible that silver could creep up and create a new high. So more specifically, we’re digging into gold and its pattern.
Ichimoku Chart
I’m going to add an Ichimoku chart to this real quick. This is on a weekly chart. I like to throw Ichimoku out there where maybe the trend seems to be a little bit uncertain. And what I use is I take a look at the cloud. You could see on a weekly chart, the price is coming in.
It’s getting ready to enter into the cloud. So it’s possible we may dip down a little bit, but this dip may be somewhat temporary as this cloud is going to try to hold pricing up. Another tool that I take a look at is a price channel.
So if I draw a price channel from now connecting these lows and then projected up on top of where this high is, we’ve got a real clean price channel in play here again, where we’re connecting the low here. We’ve also got another touch of the resistance lines up here and prices. And actually, even here on the middle line the price came in and respected this midline in a couple of different instances.
So the market thinks this channel is important and prices have broken up above this channel. So it’s possible that through the next correction, prices may come back and retest the top side of this channel line. This channel line is currently pushing through just below where 1700.0 dollars are.
Fibonacci Extensions
Another tool that I’d like to use is obviously Fibonacci, Fibonacci retracement, Fibonacci extensions. If we come out here and draw a Fibonacci retracement from this swing low up to the all-time high for gold, you can see that the price has come down and it’s rested and bounced along this 0.236, which is considered to be the minimum retracement level.
From there, if we are successful in breaking down below this level, the next level of support is going to be down here where the 0.382 is. That 0.382 also is shielded by previous support and resistance from prices in the past. And that’s also just below that 1700.0 mark.
So over the next several weeks, I think what we may be seeing in gold is we may be seeing gold breaking down into lower levels. That next level of support where a battle is going to be fought is going to be down near the 1700.0 dollars, maybe just a smidge below it as it dances with this purple trend channel and then also the 0.382 Fibonacci retracement level.
So bottom line, I think an eventual break way down the road is possible to new all-time highs for gold. In the near term, I think we may see a deeper correction developing that pushes pricing down into that 1700.0 level because we are seeing some of that divergence with silver. Let’s go on and take a peek over at silver.
We move this one out of the way. From a silver’s perspective, what really stands out to me is that high we saw back in 2011 all the way down to the low of 2020, we have come up and retraced to the 61% retracement level. So basically that is considered to be a normal retracement within the context of a downtrend.
And so we pushed up to the 0.618, retreated and retreated back down here to the 0.382. So right now prices are bouncing in between the 0.618 and the 0.382, two common Fibonacci retracement levels.
So this $22 to $30 is kind of that neutral zone. Until we break one of these levels, it’s going to be difficult to determine where the next trend is. Now, if we do break the upper level and if we break this $30 mark, then that may send prices up here to the 0.786. That’s up near 37 and a half. I’m not necessarily looking for a new all-time high in silver right away, but I think what the key level is, is this high that we saw right here.
If we break up above that high from January the 4th, then that suggests or implies that we might be breaking above the 0.618. We might work ourselves up to the 0.786. As long as we are below this high from January the 6th, then I believe we’re going to see some pressure to the downside that may come down and pressure these lows down near 22.
And a way that you can look at this from a shorter-term perspective is a look at a shorter-term chart. If you start to see prices breaking down below this trend line, that could be indicative of the mood of the market getting ready to change to lower levels.
Related Videos
Conclusion
I hope you enjoyed this video and best of luck in your trading. We will talk to you soon. Take care. Bye now.


