
Hello, TradingPedia. Welcome back here to this next video. This one is on three main stock market indices and what we can look for over the course of 2021, some support and resistance levels to watch out for from a bigger-picture perspective.
Overview
Want to take a look at DAX. Then we’re going to move over to the US. We’re going to take a look at the Nasdaq, which has been high-flying over the course of 2020. And we’ll also take a look at Dow Jones, which is also a widely followed market. So let’s dig right in.
DAX
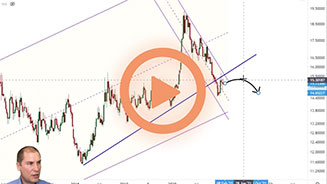
Let’s start off here with DAX. We’re going to be taking a look at a weekly chart for each of these. One thing that really stands out to me that is gonna be very important to the larger uptrend for DAX is we’ve got a horizontal level of support coming in near 8144.
This level of support contained prices or held prices back in 2000. It also held prices back in 2007 and 2008. Prices eventually came up to it, broke up above it. We saw a little bit of support coming into play here in 2014.
And then, of course, we’ve got the massive level of support that came in here in 2020. So we know from support and resistance that what was resistance when broken, acts like new support and then it has certainly been at play here on DAX.
So as a result of this, the larger trend is to the upside. If for some reason we were to get some massive sell-off, mass liquidation in the equity markets this year, if this level breaks that could really spell doom for DAX. But we’re a bit above there right now, so I don’t know if we need to worry about it at this point.
The second level, or the second thing that comes into play, when I take a look at this is when we take a look at this price channel. Prices have been conforming very nicely to this price channel. It came up and resisted prices here, resisted prices here, also acted like support here at the bottom, acted like support again here at this level.
So we’ve got two touches within this channel. We can even see how it has been dancing along the midline as well. You can see there is a little bit of a midline touch here, a little bit of a midline reaction here, and then right next to it, right here.
So this channel has been somewhat important to DAX in the past. While obviously this channel wasn’t an uptrend, it was slanted higher, prices broke below and outside of this channel beginning in 2018.
Well, what was support can act like new resistance in the future. You will notice how it came up and the price didn’t quite make it up to the bottom of the channel but it was rejected. That’s what began the 2020 pandemic sell-off.
So where we are right now. Well, right now we’re up here near some horizontal levels of resistance. I’m also taking a look down here at the bottom of the chart and I’ve got some RSI divergence coming into play down here, so this doesn’t look good. This followed some previous levels of RSI divergence back here in 2017 and 2018.
So this is certainly a tired trend to the upside. I would not be really excited about wanting to be long in this because there’s just too many indicators for resistance. We’ve got our assigned divergence showing up. It just says that there’s going to be some type of a correction that may be unfolding.
The way that I like to look at these is, you know, draw you a level of support. It could be trend-line support, it could be horizontal levels of support. And if you’re looking to short, wait for these levels to break before initiating that because this could continue to work itself higher, but yet the larger trend may be trying to shift downward.
So when we break these levels of support that would indicate that the larger trend has indeed shifted downward. So this line is currently crossing through about 13100. That could be a level where we can look for some short side to the action here.
Nasdaq
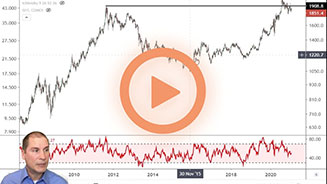
Let’s take a look at Nasdaq. Nasdaq has really been on a tear over the last decade. The thing that stands out to me on Nasdaq is we’ve got this longer-term price channel. It’s been containing prices since 2010.
Earlier this year, in the summer of 2020, prices broke up above and outside of this price channel, came back, rested on top of it twice, and have continued to motor higher. This channel is going to prove to be very important in the future because when a correction does take place, not if, but when a correction does take place, if this resistance line on the channel or this upper channel cannot support prices, then we’re going to have even deeper sell-offs coming.
So, for example, if the price was to correct lower and come down here to this line, if it does not support and move higher, and if it ends up breaking down, then we’re probably gonna be looking at much lower prices as we work down to the lower end of this price channel.
So just like what we talked about on DAX, what I would be looking at here, I’ll be looking for a trend line. If this trend line were to break, then that could indicate that perhaps we’re looking at some type of a consolidation or maybe a correction taking place even down here on RSI. We’ve got RSI divergence taking place. This is not good. This is a tired trend to the upside. Probably we’re going to see some consolidation, some type of a correction taking place.
Dow Jones
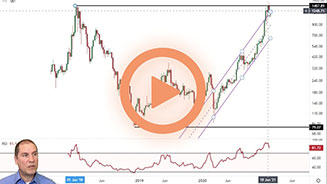
Lastly, on Dow Jones I’m going to incorporate a little bit more advanced technical analysis so just bear with me here for a moment. What I’ve got on the charts right now are Elliott Wave labels, a five-wave move. It’s possible that we can count this fifth wave higher as being in place or almost as being in place.
Now, there’s a couple of things that are interesting to me about this. If we draw a channel connecting the end of wave 2 and the end of wave 4 and we just kind of project this up here towards the end of wave 3, you will notice that prices have come up and gotten really close to rubbing the underside of this resistance level. This resistance level is not much higher than where we are right now, maybe another thousand Dow points. The point is not much.
And so that, in addition to the RSI divergence, suggests that we also have another tired trend here. All these three equity markets are indicating a tired trend and that we may be seeing a shift, a lowering in price coming, some type of consolidation, some type of correction.
Another interesting aspect here with regards to Elliott Wave. I’m going to get out in the weeds for a little bit, but for those who are interested in Elliot Wave and how it works, I want to measure out the distance of wave 1 and project it up here at the end of wave 4. Wave 5 equals the length of wave 1 about right where it is right now. That’s a very common wave relationship with an Elliott Wave.
Related Videos


Conclusion
So bottom line, I would not want to be long in this market. Yes, there might be potential gains continuing to the upside but you would have to be very nimble on that portion of the trade and just suggest that there may be some type of a consolidation coming. With this price channel, look for the midline, look for the lower line as potential larger areas of support.
In the meantime, you could look to zooming-in and looking at a support trend line – this blue trend line breaks. That may suggest that the mood of the market is getting ready to change. So wish you best of luck in your trading. And we will talk to you soon. Take care. Bye now.