Williams Percent Range
This lesson will cover the following
- Definition
- Calculation
- Interpretation
 Developed by Larry Williams, the Williams %R is a momentum oscillator designed to determine overbought and oversold market conditions. It is best applied to trending markets.
It is exactly the opposite of the Fast Stochastic Oscillator in that it compares the closing price to the highest high during the lookback period, while the Fast Stochastic Oscillator reflects the closing price relative to the lowest low. The Williams %R then corrects the inversion by multiplying the result by -100. Thus, the two oscillators’ readings are an exact match (when used with the same lookback span, of course) but their scaling is different.
Whereas the Fast Stochastic Oscillator oscillates between 0 and +100, the Williams %R varies between -100 and 0. The areas between -20 and 0, and -100 and -80 are considered overbought and oversold, respectively. Another difference between the two is that the Williams %R has no internal smoothing.
The logic behind the Williams %R is that the closer the price is to the highest high of the high-low range tracked within the lookback span, the higher the Williams %R value will be, and vice versa. If the closing price touches the highest high, the indicator will reach 0. Conversely, if it drops to the lowest low of the tracked range, it will fall to -100.
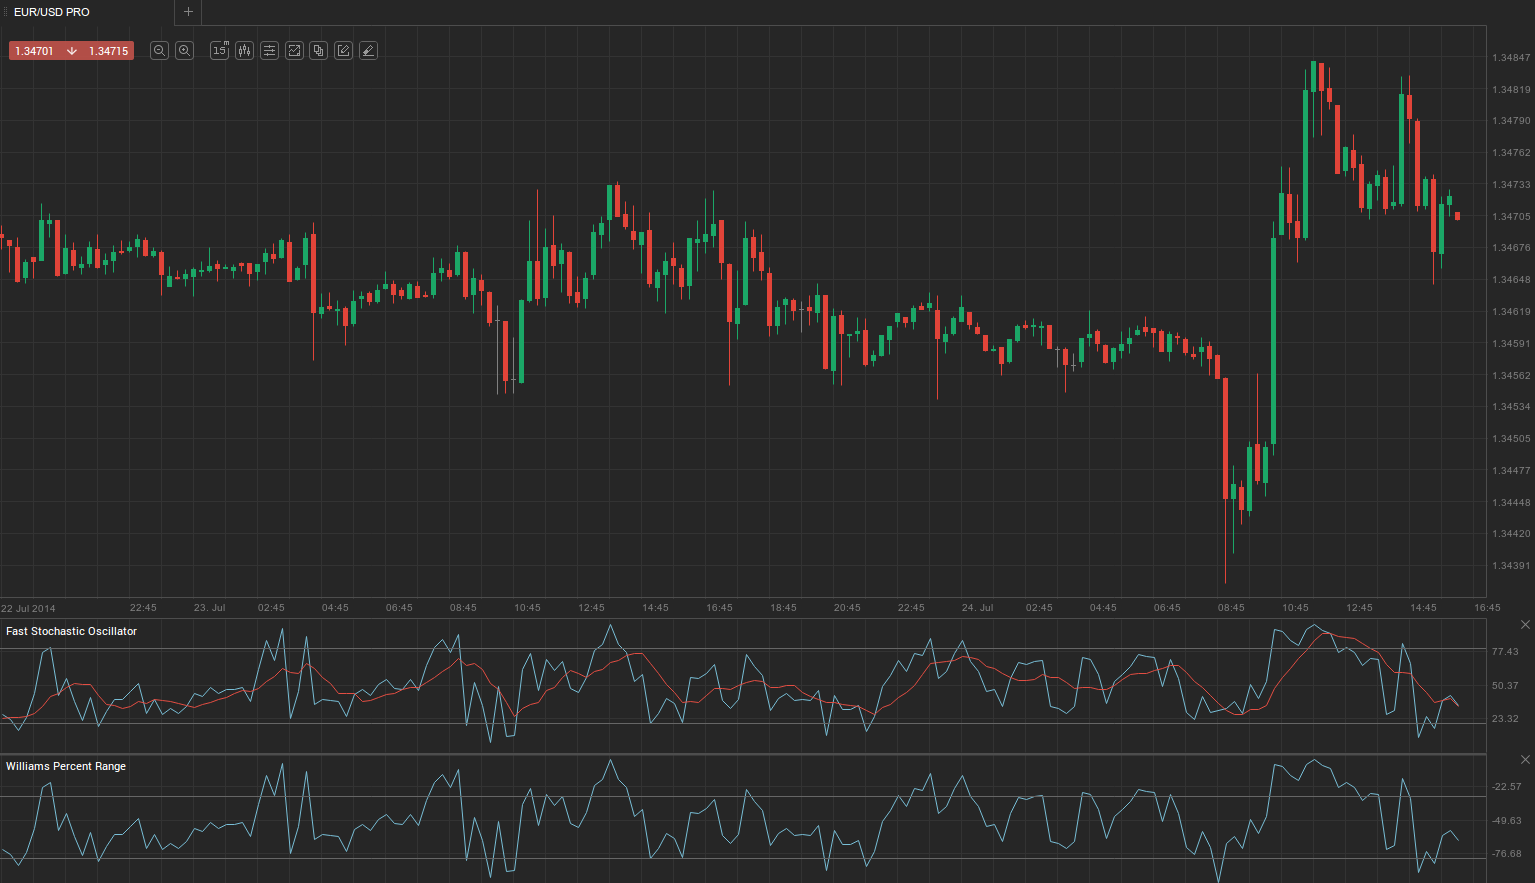
In the screenshot below, both the Fast Stochastic Oscillator and the Williams %R are visualised, each tracking the Williams %R’s default 14-period lookback. As you can see, they are an exact match.
Here is the formula used to compute the Williams %R value:
%R = (Highest High – Close) / (Highest High – Lowest Low) x (-100), where:
– Close is the closing price for the current period
– Highest High is the highest price reached during the lookback period
– Lowest Low is the lowest price touched during the lookback period
Trading the indicator
 Just like any other bounded oscillator, the Williams %R is designed to identify overbought and oversold conditions, which in turn signal possible price reversals or at least retracement levels. As mentioned, the range between 0 and -20 is considered overbought, while values between -100 and -80 are deemed oversold. Of course, these levels can be adjusted to match current market conditions – if volatility is consistently low, the thresholds can be widened, for example to -30 and -70.
Generally, overbought and oversold conditions indicate an upcoming reversal or at least a retracement, but this is not always the case. During strong trends, when the dominant side is exerting persistent buying or selling pressure, the market may become overbought or oversold and remain in that state for an extended period.
Thus, frequent successful overbought and oversold reversals are most typical of ranging markets and weaker trends. Generally speaking, a buy signal is generated when the oscillator’s value falls into oversold territory, reverses, and moves back into the normal range. Conversely, a sell signal is produced when the asset becomes overbought, then reverses, and the Williams %R returns to normal values.
Another hint of an upcoming reversal appears when the Williams %R repeatedly enters the overbought or oversold area – a sign of strong buying or selling pressure – but, at some point, momentum weakens and it is no longer capable of reaching the extreme zone. For example, if a currency rises above -20 on two or three consecutive occasions but fails on the fourth attempt, it suggests that the diminishing buying pressure exerted by bulls may precede a price decline.