Inertia indicator
This lesson will cover the following
- Definition
- Interpretation
Developed by Donald Dorsey, the Inertia Indicator is an extension of Dorsey’s Relative Volatility Index and is used to define the long-term trend and how far it has extended. Its name alludes to the physics concept, referring to the direction and mass of motion.
Dorsey states that a trend is simply the ‘outward result of inertia’ and, as such, the market will require much more energy to reverse its direction than to extend the ongoing move.
Determining the direction of motion is easily achievable using technical analysis. However, defining mass is more complicated, and Dorsey argued that volatility is the simplest and most accurate gauge of inertia. For these purposes he used the aforementioned Relative Volatility Index, smoothing it with a linear-regression indicator.
- Trade Forex
- Trade Crypto
- Trade Stocks
- Regulation: NFA
- Leverage: Day Margin
- Min Deposit: $100
The Inertia indicator is plotted on a scale of 0 to 100, and its mid-point of 50 acts as a threshold separating uptrends from downtrends. Thus, crossings below or above the line suggest that a trend reversal is most likely under way, which generates entry signals or prompts exits from current with-trend positions. Here is what the indicator looks like on a trading platform.
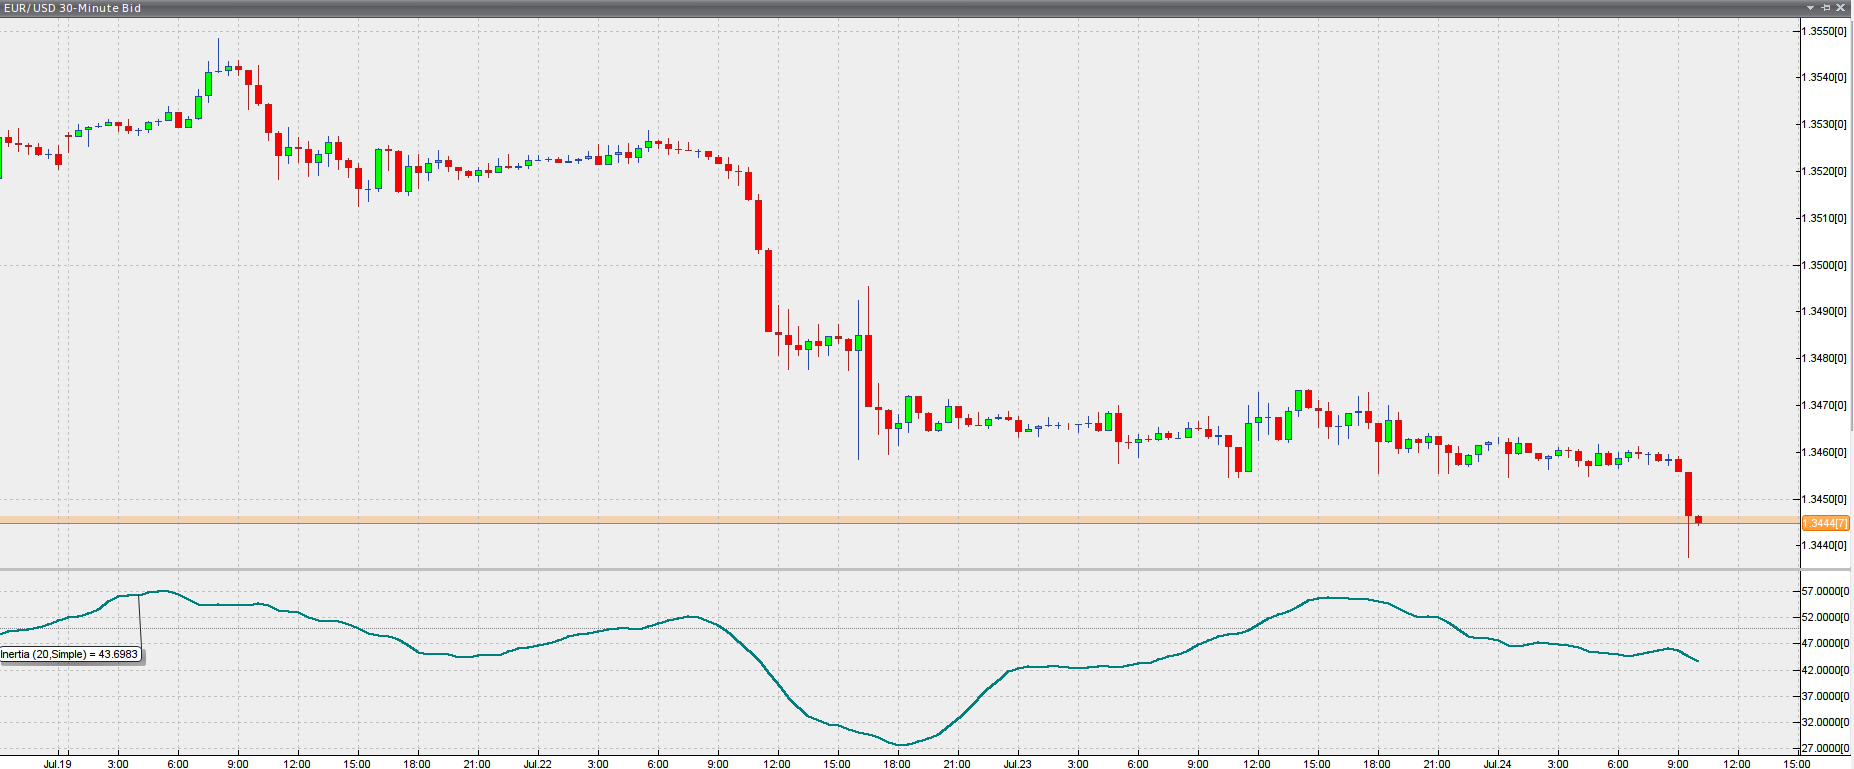
Chart source: VT Trader
For example, if Inertia is below the mid-level but edges higher past 50, a buy signal will be generated as soon as the upward cross is confirmed by a bar closing above it. When the uptrend later ends and Inertia drops back below 50, the trader should close his long position. The opposite applies in a bear trend. However, the Inertia indicator should not be used as a sole basis for decision-making; rather, it should be combined with other indicators, for example the Parabolic SAR, to achieve a more elaborate trading strategy.