Throwbacks and Pullbacks
This lesson will cover the following
- What are Throwbacks and Pullbacks in Forex
- How to find them on the chart?
- Why the market pulls back and throws back
Throwbacks, and their opposite, pullbacks, are two of novice traders’ most hated patterns because of the panic and early exits they cause. However, because these patterns tend to occur relatively often – around 20% of the time – you can learn to protect your position effectively and even use them to accumulate profit.
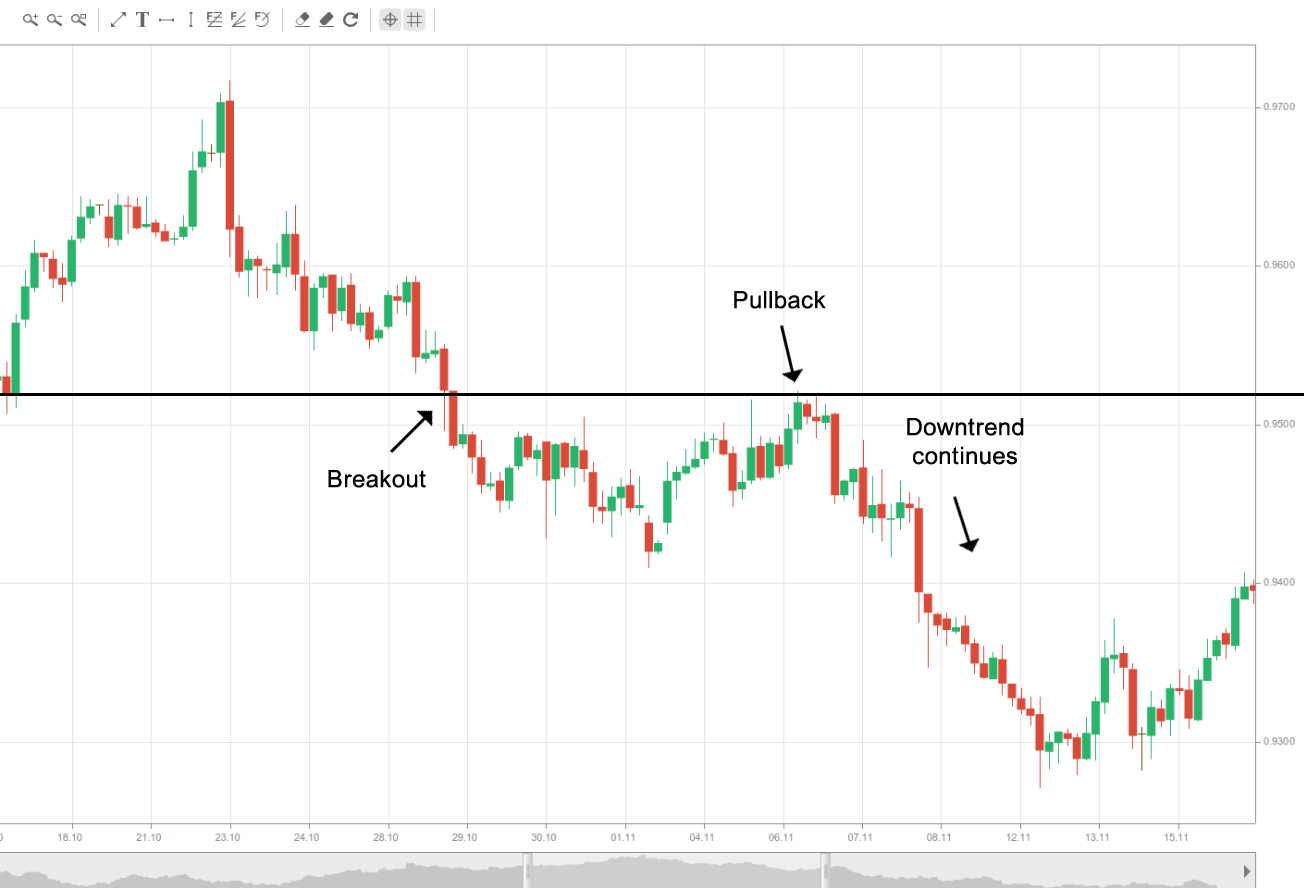
A pullback occurs when the price breaks below a support level, retraces to that support (which, however, now begins to act as resistance) and then rebounds from it, continuing its downward movement. You can see a pullback illustrated in the screenshot below.
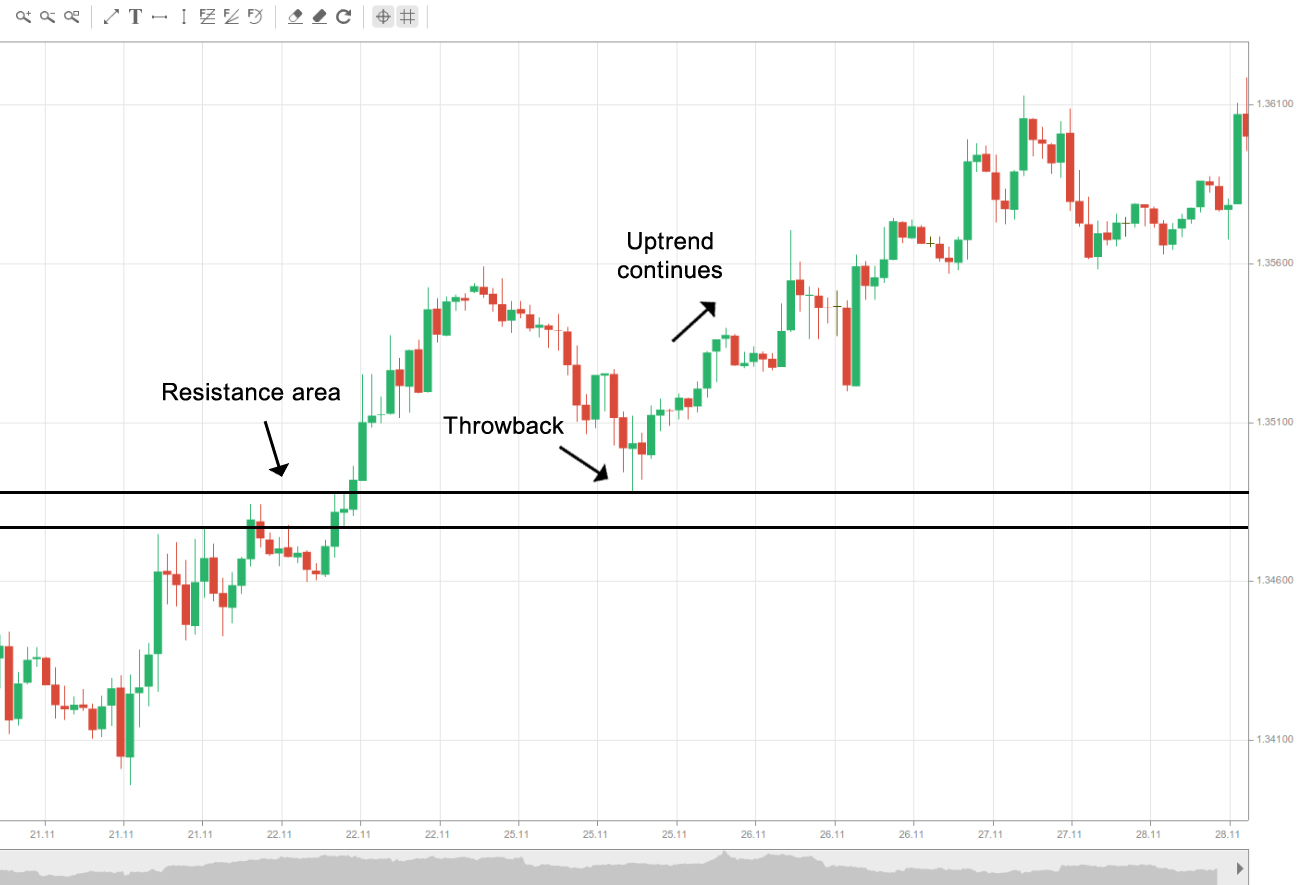
The opposite pattern, the throwback, is therefore a mirror image of the pullback. A throwback occurs when the price breaks above an established resistance, retraces to that resistance (which has now switched roles and acts as support) and then bounces back up. A throwback is illustrated on the following screenshot.
Yes, this set-up can seem a little tricky, especially for the novice trader, but there is nothing to worry about once you’ve studied it and placed adequate stop-loss protection.
The pattern plays out like this. As soon as the price breaks through the support or resistance zone, it generates a buy or sell signal and traders tend to enter the trade. However, as the price reverses and touches the resistance/support level that was recently broken, the position turns into a losing one shortly after we’ve entered it.
This is where a novice trader may become frightened and panic, assuming the set-up must be wrong. However, if you are familiar with throwbacks and pullbacks and, of course, if you have placed a protective stop below your entry point, you can remain calm, since even if the pattern doesn’t play out you will incur only a minor loss. It is even possible that a highly experienced trader has not yet entered the market, because he or she may be waiting for the price to retrace further through the newly formed support/resistance before it bounces back, gaining several extra pips of movement.
- Trade Forex
- Trade Crypto
- Trade Stocks
- Regulation: NFA
- Leverage: Day Margin
- Min Deposit: $100
What causes throwbacks and pullbacks
 When a price finds resistance at a certain level and later breaks through it, traders who did not anticipate a breakout and went short just beforehand incur losses as prices surge and break the resistance level. However, as the price falls back to the previously defined resistance level, those who went short want to close their positions once their losses have been minimised. And since closing a short position actually means buying the asset, they bring buying pressure back to the market, thus pushing prices up.
As soon as other market participants who have not yet entered see that the previously established resistance level has begun acting as support, they place long-entry orders (because what they see is a rebound from support – a bullish signal). This additional buying pressure, coupled with short covering, further lifts the price and can lay the groundwork for the start of an upward trend.
If you look through some previous price charts, you’ll see that these patterns tend to occur quite often. The price chart areas where most people want to enter a trade are usually the most volatile areas – here prices are consolidating, traders are opening or closing positions, and stop-loss hunters lie in wait. Therefore, it is important that we become comfortable with this volatility and also get used to the fact that chart patterns often do not look exactly like the ones in the books, if we want to survive longer in the market.
Important rules
 You should keep in mind the following important guidelines for throwbacks (because pullbacks are the mirror image of throwbacks, the same is true for them except that the direction is opposite):
 Remain calm and don’t panic when the market begins to retrace after the breakout. Once the throwback ends, there is a high probability that the initial upward movement will resume.
 Unusually high volume tends to increase the chance of a throwback occurring. If a breakout is accompanied by notably high volume (for example, above the 30-day average), there is a good chance of a throwback. The pattern occurs three times more often following an above-average-volume breakout than after a below-average one.
 If you are a more flexible type of trader, you can buy as soon as the price breaks through the support/resistance and sell after the price has peaked, before the retracement occurs. You can then enter a long position again just after the throwback ends and take advantage of the strong upward movement. This strategy, however, carries a higher risk because it is difficult to gauge the beginning and end of the retracement in advance.