The Forex trend – a trader’s best friend
This lesson will cover the following:
- Basic terms regarding the trend
- How to identify a trend
- Trend lines and how to apply them
- The trend in Dow Theory
As mentioned earlier, technical analysis is based on several assumptions, one of which is that global markets trend. Usually, market participants hope to purchase an instrument at the beginning of an upward trend at a low price, follow the trend and then sell the instrument when the trend ends at a higher price. It sounds simple, but achieving it in a dynamic market can be quite complex. This is because determining a trend and a possible trend reversal is, in many cases, a subjective decision that relies both on the skills and experience a trader possesses in the Forex market, and on his or her ability to control emotions. All investors make mistakes, but professionals know how to rectify them in a timely manner.
Basic terms
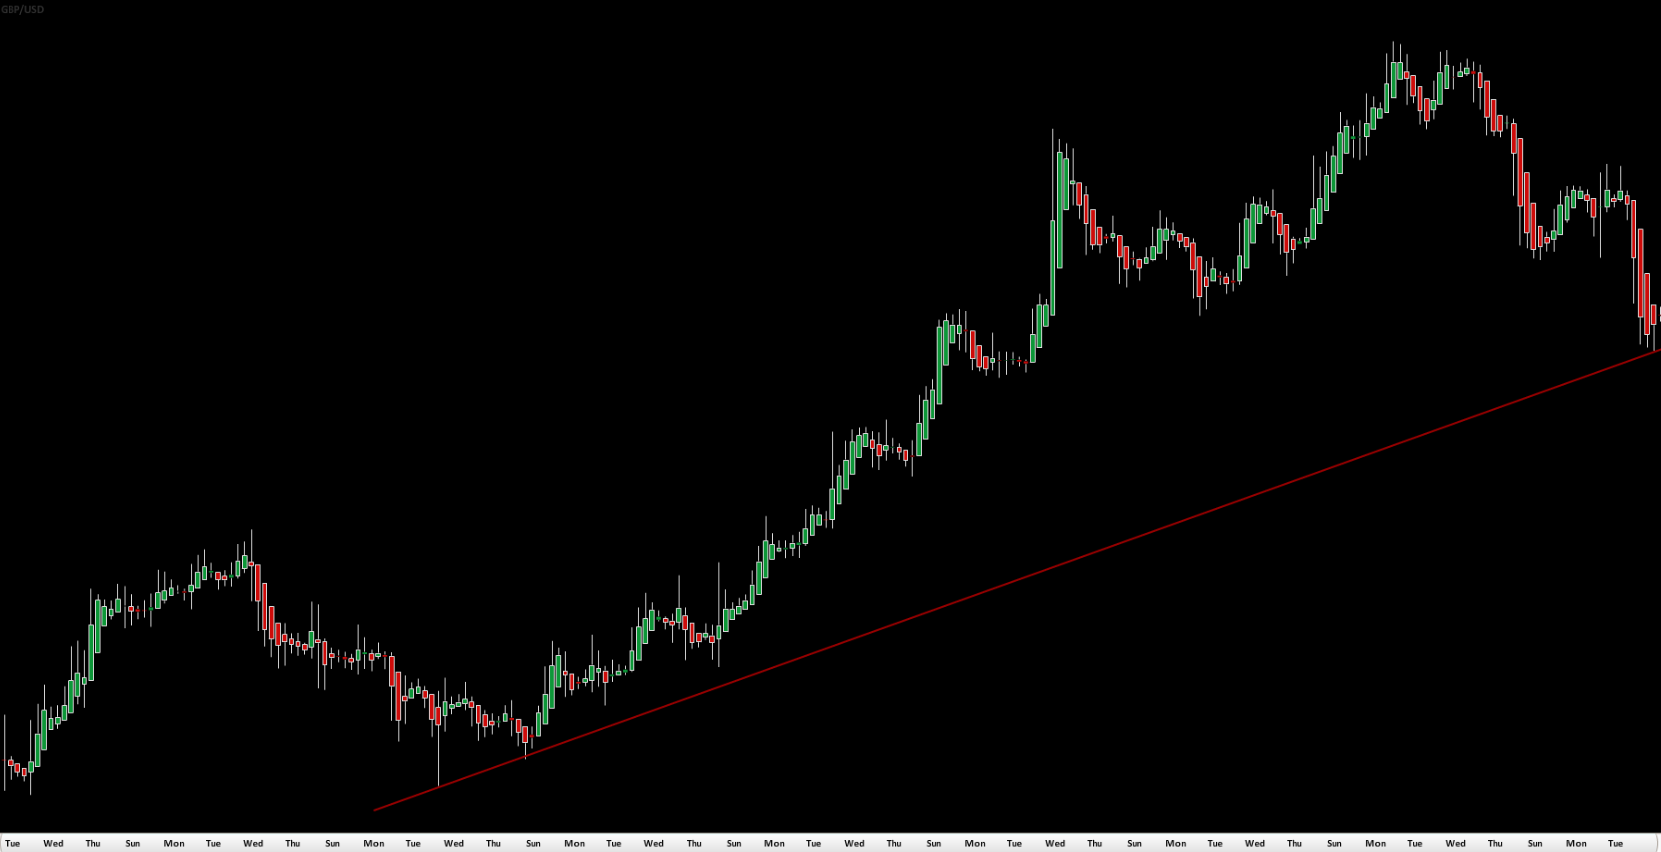
 A trend defines the direction of market prices. When we refer to a trend, we mean a directional movement (formed by rising or falling prices) from which a trader can generate a profit by using an appropriate trend-following method. A rising trend (uptrend) is formed when prices reach higher peaks and higher troughs.

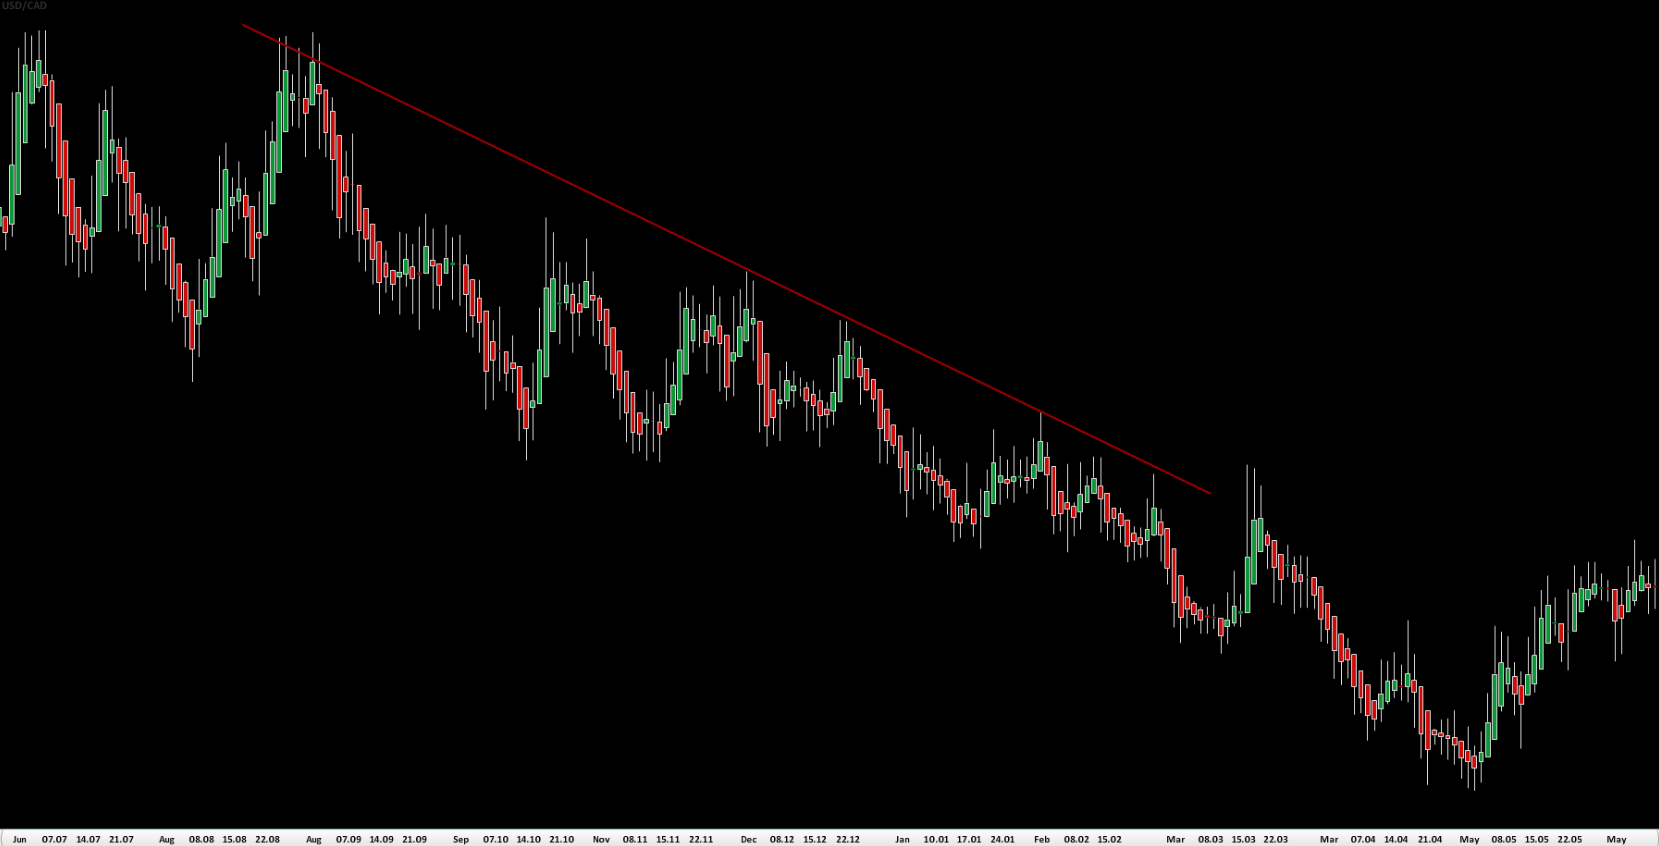
A decreasing trend (downtrend) is formed when prices reach lower peaks and lower troughs.

A sideways trend (flat trend) occurs when prices trade within a specific range without showing a significant upward or downward movement. They oscillate but remain at approximately the same level. This configuration often appears after a larger trend has paused temporarily. A flat trend is also called a consolidation or congestion area.

It is vital to mention that trend-following methods show good results only during uptrends and downtrends, but they do not work properly in non-trending markets. In order to deal with sideways trends, most technical analysts use price oscillators. We shall examine these techniques at a later stage.
In strategic terms, an investor who relies on technical analysis must decide, first, when to enter a position, and second, when to exit the market. Exiting a position, however, consists of two decisions. The investor must decide when to exit a position to lock in a profit when prices move in the expected direction, and when to exit at a loss when prices move contrary to expectations. Every trader needs to be aware that the actual trend might differ from what he or she anticipated. Therefore, deciding at what price level to sell and limit losses before entering a position is a sensible way to protect against large losses.
To profit with the help of technical indicators, every trader should remember to follow the trend, control the risk of loss and avoid risk of ruin.
- Trade Forex
- Trade Crypto
- Trade Stocks
- Regulation: NFA
- Leverage: Day Margin
- Min Deposit: $100
How can we identify a trend?
 It is important to note that price action does not follow a continuous, uninterrupted line. Small counter-trend movements within a trend can make the overall direction difficult to identify. In addition, because trends vary in length, shorter-term trends are components of longer-term trends. For a technical analyst, a trend is a directional movement of prices that remains valid long enough to be identified and traded. A trend should therefore be detected as early as possible and last long enough for a trader to profit from it.
Some analysts prefer to use moving averages to smooth out shorter trends within the trend of interest and identify the longer-term trends.
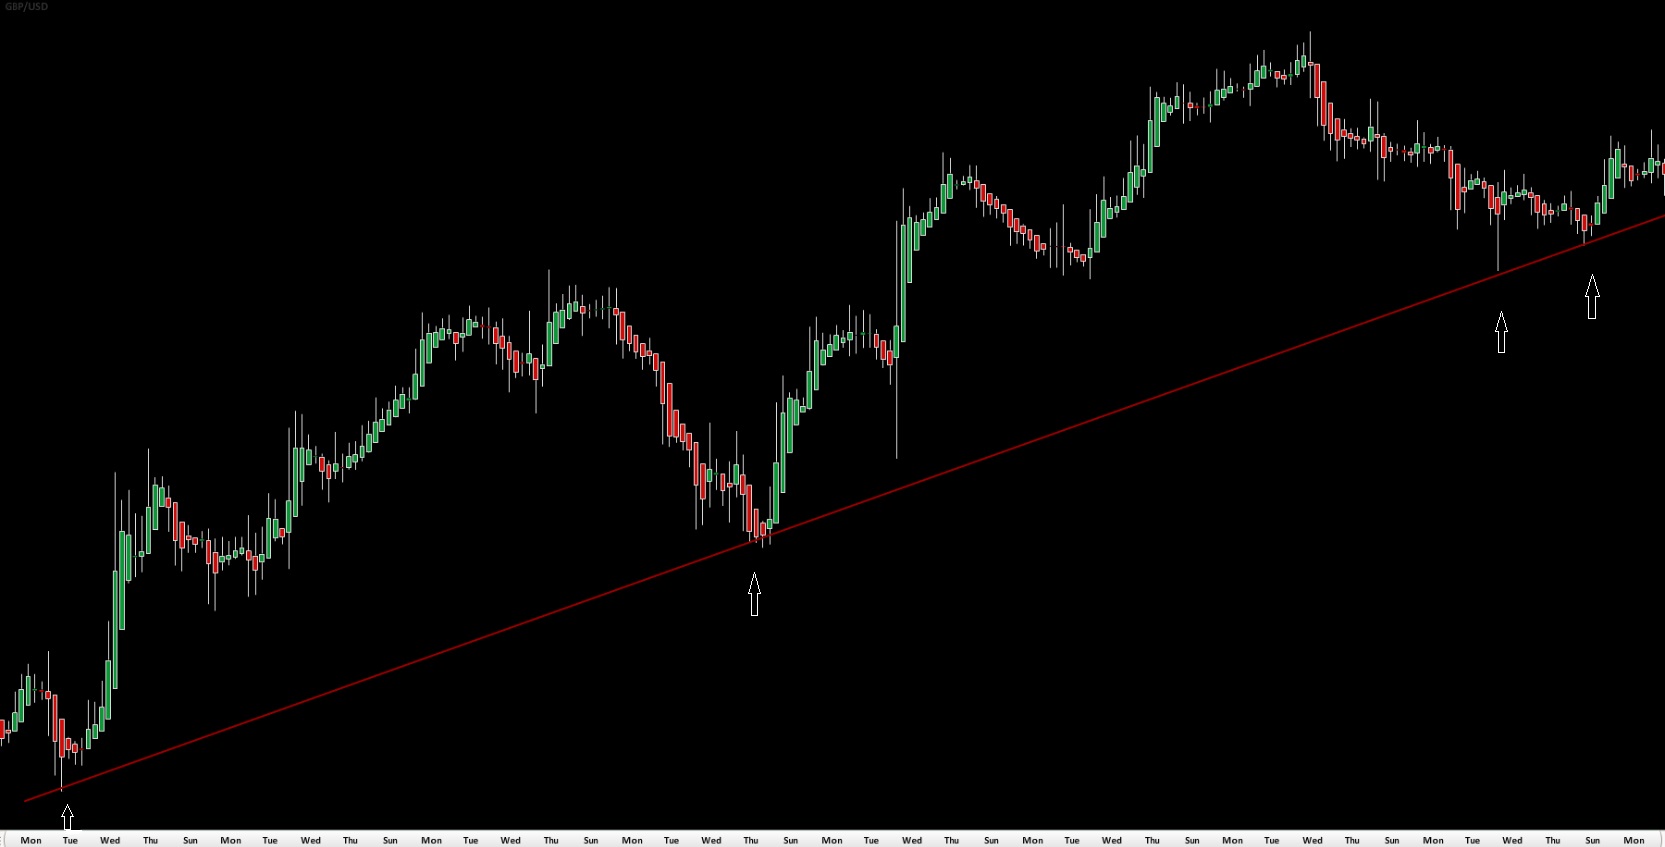
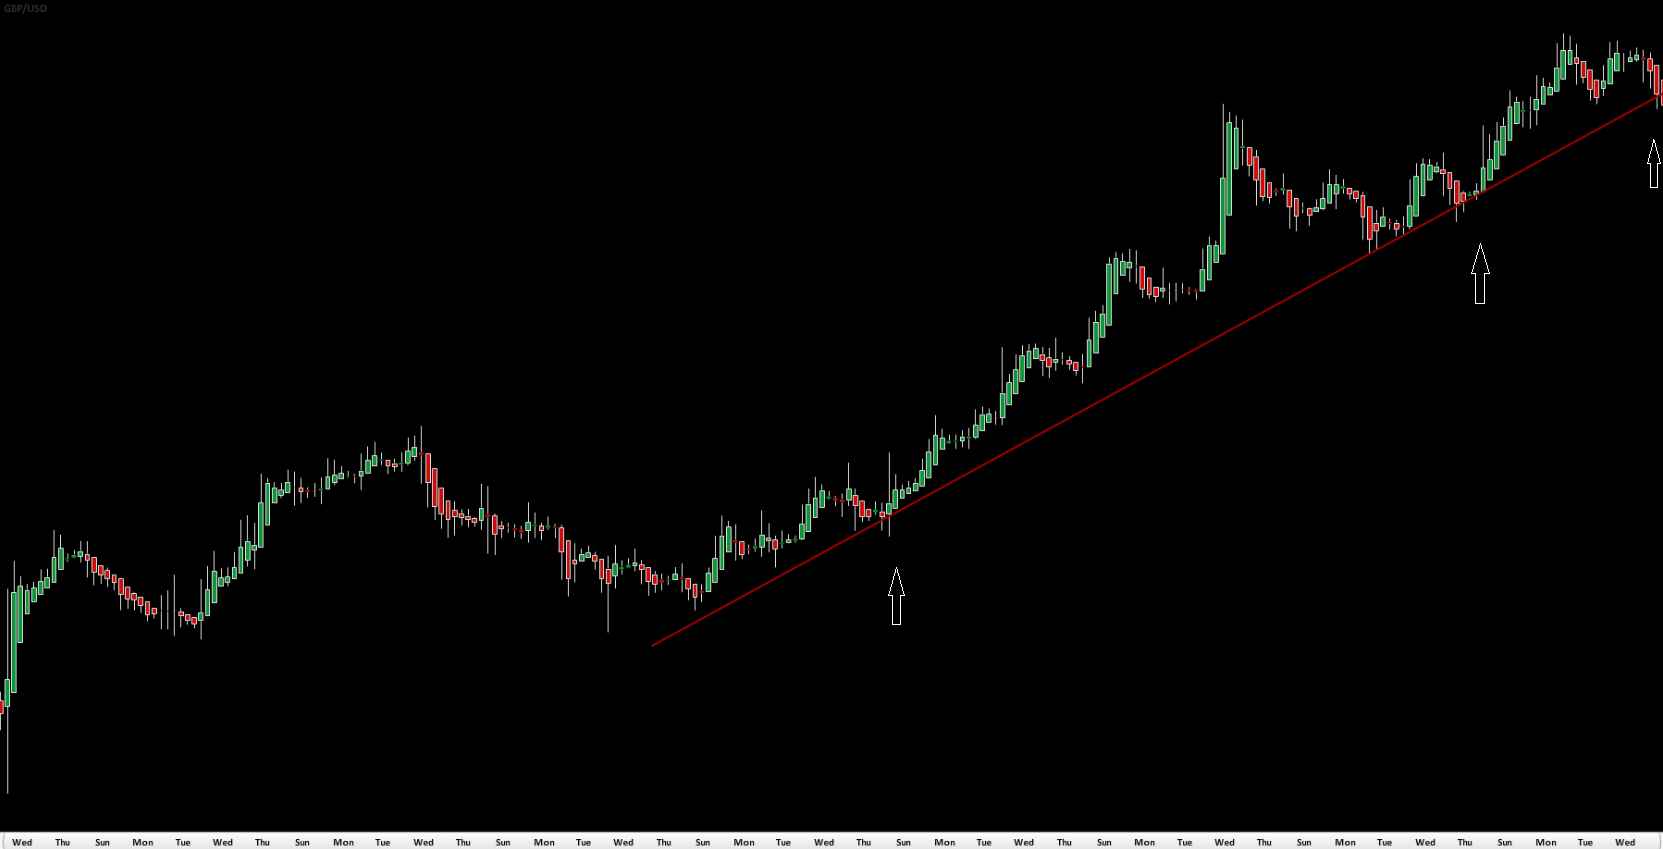
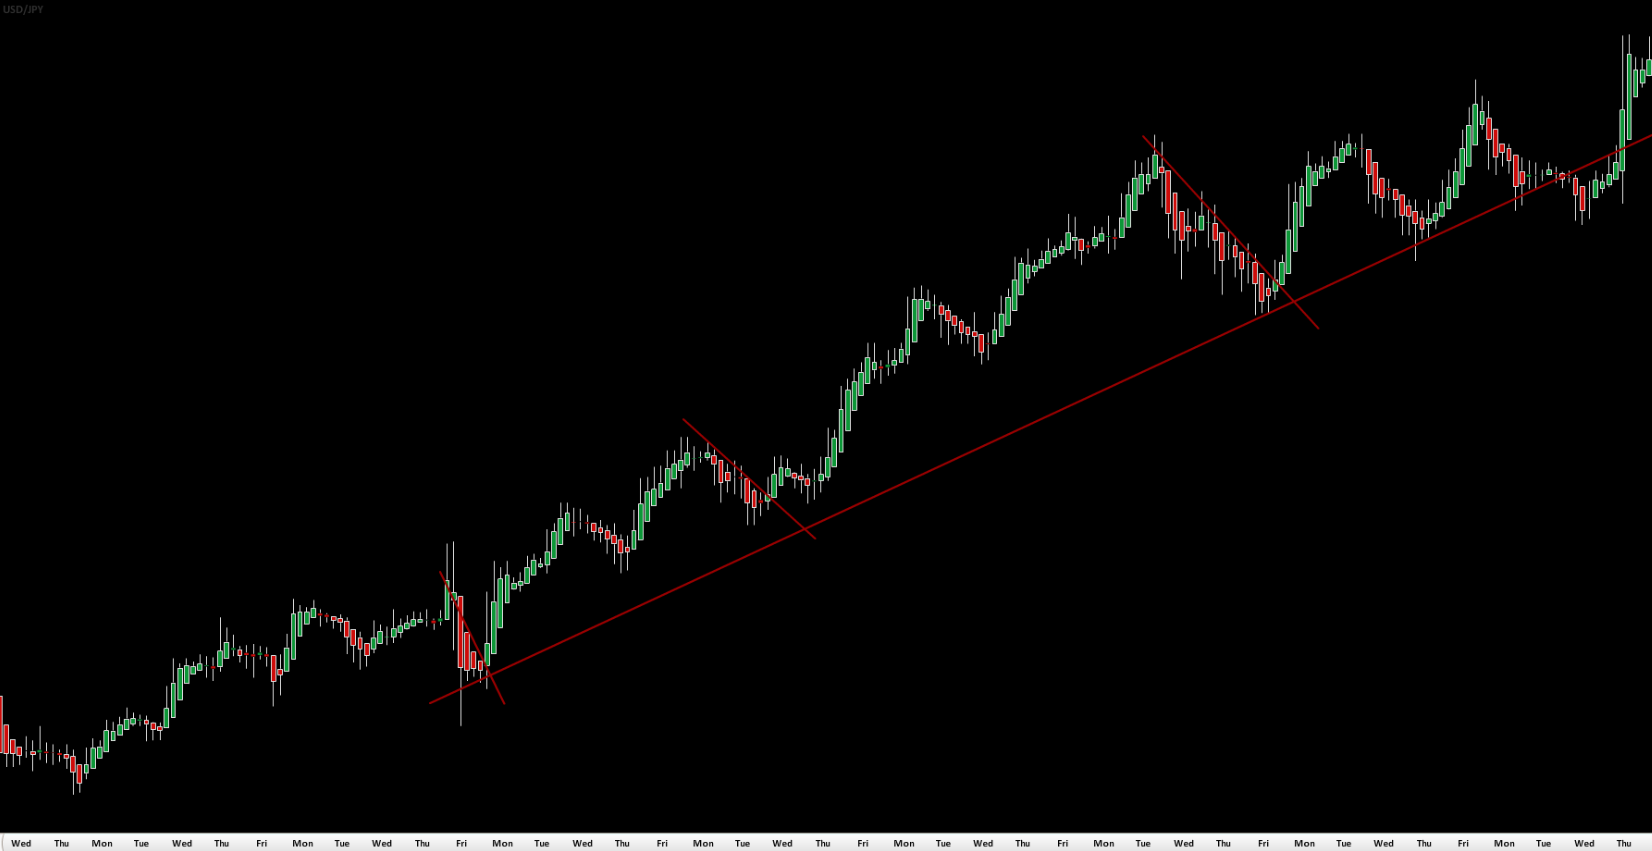
Another method of identifying trends is to examine a price graph, look for extreme points (peaks and bottoms) separated by certain periods, and then draw lines between these points. These lines are called trend lines. By connecting extremes – top to top and bottom to bottom – a trader gains an idea of price direction and its limits. Trend lines are used to define the boundaries of price action; if these boundaries are broken, the trend may be reversing.
When drawing trend lines during a downtrend, the lines are usually drawn above the price action. When drawing trend lines during an uptrend, they are generally drawn below the price action. A trend line is determined by highs (peaks) during a downtrend and by lows (bottoms) during an uptrend. At least two swing highs or two swing lows are needed to draw a trend line. However, for the line to be considered valid, at least three peaks or three bottoms should be used.
When drawing trend lines, some traders prefer to use the bodies of the candlesticks, while others prefer the wicks. Either method is acceptable.
The trend in Dow Theory
 Charles Dow was one of the first modern technicians to state that market prices move in trends. According to Dow, traders should concentrate on the time horizon that best suits their preferences.
The theory states that all trends are fractal, meaning that their behaviour is the same regardless of the time frame. Minute-to-minute trends demonstrate exactly the same behaviour as day-to-day trends, with only minor differences caused by variations in liquidity over shorter periods.
Dow suggested three principal time horizons: the primary, the intermediate and the minor, which he compared to tides, waves and ripples.
Another crucial observation was that trends are more likely to continue than to reverse. If this were not the case, a trend would not exist and could not be used for profit.
Lastly, according to Dow, every trend is influenced by the trend one degree higher and one degree lower. Within an uptrend there are many smaller trends (up and down), which themselves consist of even smaller uptrends and downtrends. This again underscores the fractal nature of trends. The longer trends usually influence the strength of the trend of interest, while the shorter trends often provide early signs that the longer trends could be reversing. On the following graph we visualise a large (major) trend with a number of small trends within it.
Shorter-term trends tend to reverse before medium-term trends, and medium-term trends tend to reverse before long-term trends.