Symmetrical, ascending and descending triangles
This lesson will cover the following
- How is a symmetrical triangle formed?
- How is a descending triangle formed?
- How is an ascending triangle formed?
- How to trade triangle formations?
When a pattern has boundary lines that are not parallel and, if extended into the future, eventually cross, it forms a triangle. These formations may arise from a lower boundary with an upward slope or from an upper boundary with a downward slope.
Within a triangle, the point at which the two boundary lines extend and eventually cross is known as the apex. The distance between the first high reversal point and the first low reversal point is known as the base.
Several standard types of triangle can be recognised: symmetrical, ascending and descending.
Symmetrical triangles
These triangles usually have a downward-sloping upper boundary and an upward-sloping lower boundary, which gives the pattern a broadly horizontal orientation. In other words, prices make lower highs and higher lows at roughly the same pace. Within a symmetrical triangle, the two boundary lines appear to have the same angle but point in opposite directions. The interior of the triangle is usually filled with price action, and prices should touch each boundary line at least twice.
Symmetrical triangles are often regarded as continuation patterns (suggesting a pause or consolidation in the prior trend) rather than reversal patterns; however, this is not a strict rule. As highs and lows tend to approach each other and eventually reach an apex, the direction of the triangle is flat. Therefore, symmetrical triangles should not necessarily be viewed as patterns that signal exhaustion of the prior trend. Instead, they represent periods of consolidation, when market participants are largely indecisive.

Here we can see a symmetrical triangle with a breakout to the upside.
Within these triangles, price volatility usually diminishes because, as noted, the distance between highs and lows narrows.
Within these formations, neither the long-positioned nor the short-positioned players can dominate until, eventually, the majority of traders commit to a direction. This is when a breakout from the triangle occurs. Some technical analysis studies have found that in 54% of cases the breakout is upward. However, these triangles can produce many false breakouts, so traders should exercise caution.
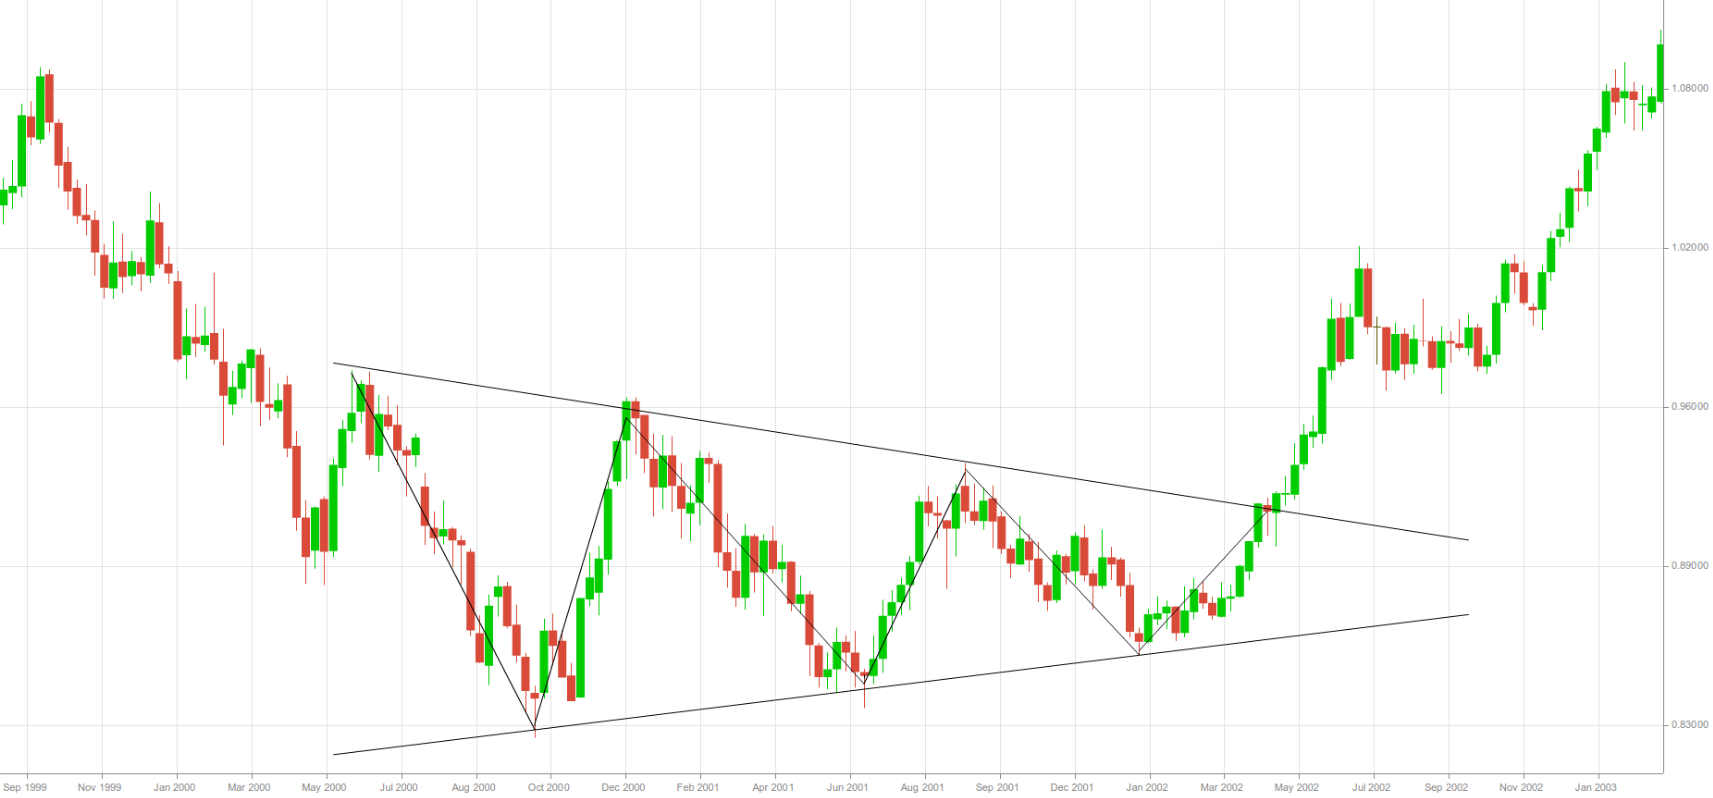
The 1-week EUR/USD chart above shows what a reversal symmetrical triangle looks like.
- Trade Forex
- Trade Crypto
- Trade Stocks
- Regulation: NFA
- Leverage: Day Margin
- Min Deposit: $100
Ascending triangles
These triangles typically have a horizontal upper boundary (resistance line), while their lower boundary slopes upward. In other words, prices form higher lows while the resistance line caps price action until a breakout eventually occurs.
Ascending triangles indicate that long-positioned traders are dominant, as price action forms higher lows, whereas short-positioned players show progressively less strength. Although sellers manage to repel buyers from the resistance level, each attempt becomes progressively weaker. As sellers fail to drive the price back to previous lows, buying pressure increases, with more participants joining in. Prices therefore move ever closer to the resistance line until it is finally breached.
Although some theories state that the breakout will follow the direction implied by the triangle (an upward breakout in 77% of cases), it is not uncommon to see the move develop in the opposite direction if the resistance line proves too strong for buyers.

Here we can see an ascending triangle with a breakout to the downside.
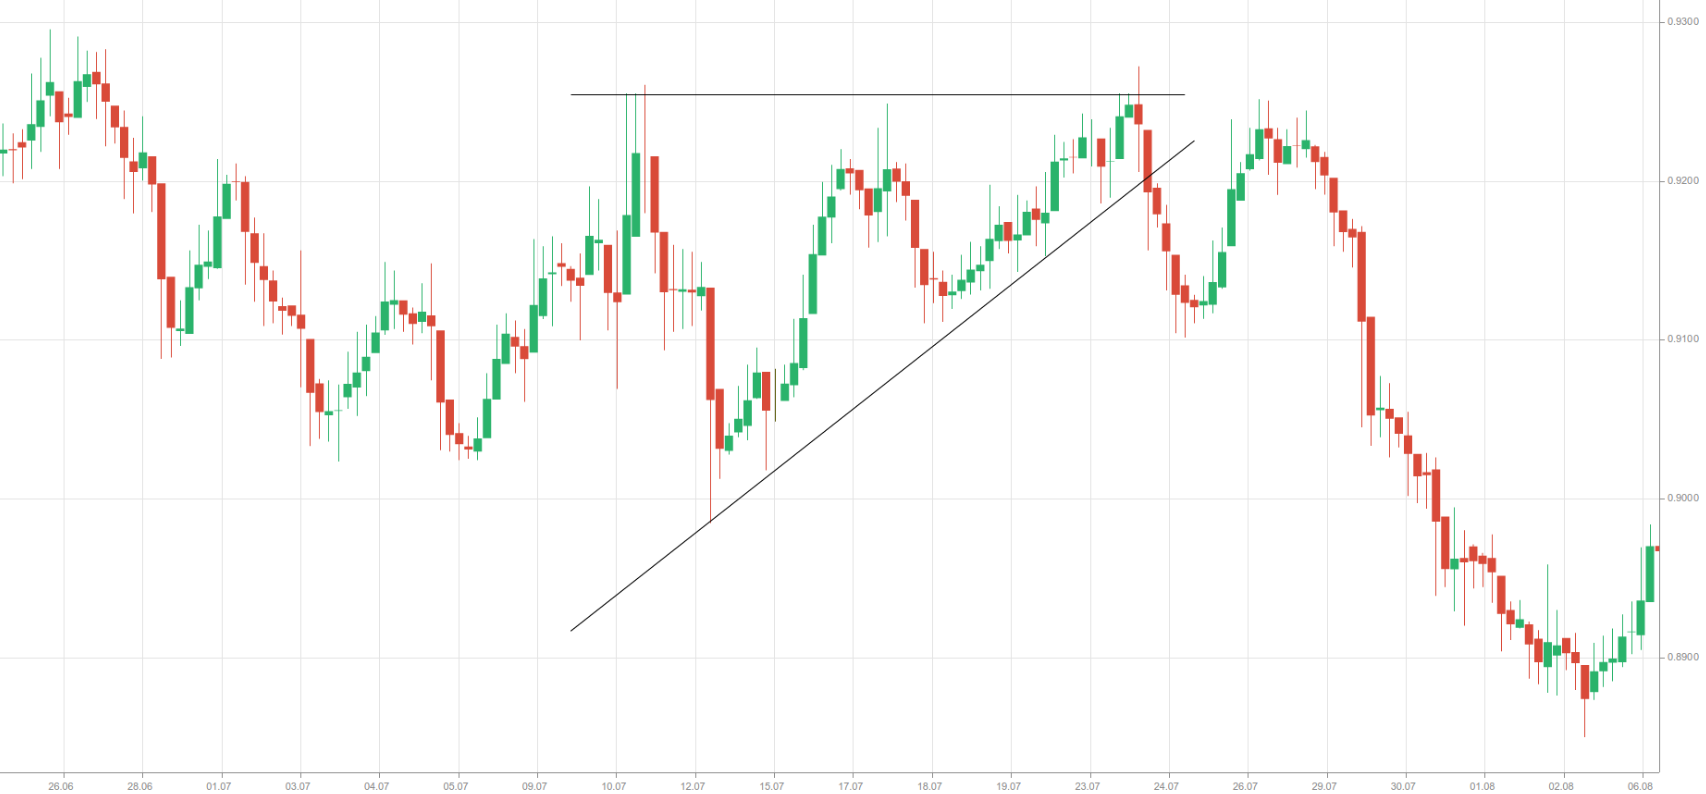
The 4-hour AUD/USD chart above shows an ascending triangle that reflects the continuation of the prior downtrend.
Descending triangles
These triangles typically have a horizontal lower boundary (support line), while their upper boundary slopes downward. In other words, prices form lower highs while the support line limits price action until a breakout eventually occurs.
Descending triangles indicate that short-positioned traders are dominant, as price action forms lower highs, while long-positioned players display gradually weakening strength. Although buyers manage to fend off sellers and push the price away from the support level, each rebound is weaker than the last. As buyers cannot push the price back to previous highs, selling pressure eventually intensifies, with more sellers entering the market. Prices therefore move ever closer to the support line until it is finally breached.
Although some technical analysis studies have concluded that a breakout occurs in the direction of the triangle (a downward breakout in 64% of cases), a move in the opposite direction is not unusual if the support line proves too strong for sellers.

Here we can see a descending triangle with a breakout to the downside.

Here we can see a descending triangle with a breakout to the upside.
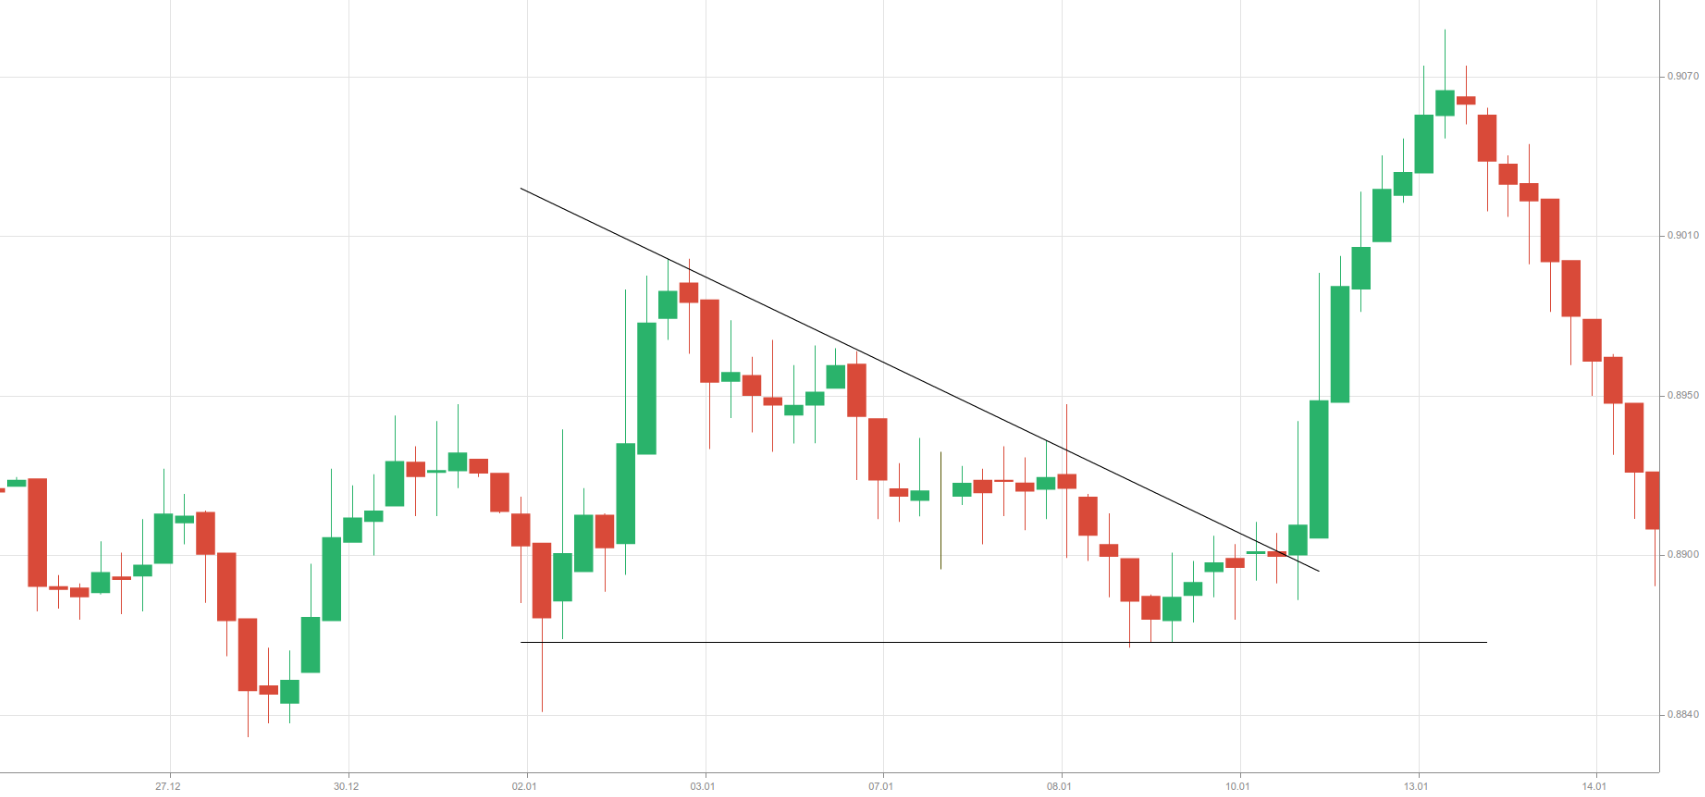
The 4-hour AUD/USD chart above shows a descending triangle that reflects the continuation of the previous uptrend.
Trading triangles
The optimal time to trade triangles is when a breakout occurs. The direction of the breakout does not have to be forecast in advance. Traders should simply act in the direction of the breakout once it occurs. If traders are already in a position when the pattern begins to form, they should generally hold it while the triangle develops.
If the breakout develops in the opposite direction to an existing position, that position should be closed. A breakout against the position increases exposure to risk. The adverse price movement can be considerable, especially if the breakout signals a reversal of the major trend.
A breakout occurs when price action breaches one of the triangle’s boundaries. When this happens, a trader should enter a long position if price action breaks the resistance line, or a short position if it breaks the support line.
To guard against a false breakout, the trader should wait for a candle to close outside the pattern. However, if the candle closes too far outside the pattern, the potential profit diminishes because the entry is late.
Protective stops are usually placed just beyond the opposite side of the pattern. If price action breaches the support level, the trader should enter a short position, placing the stop-loss just above the resistance level. Conversely, if price action breaches the resistance level, the trader should enter a long position, placing the stop-loss just below the support level.
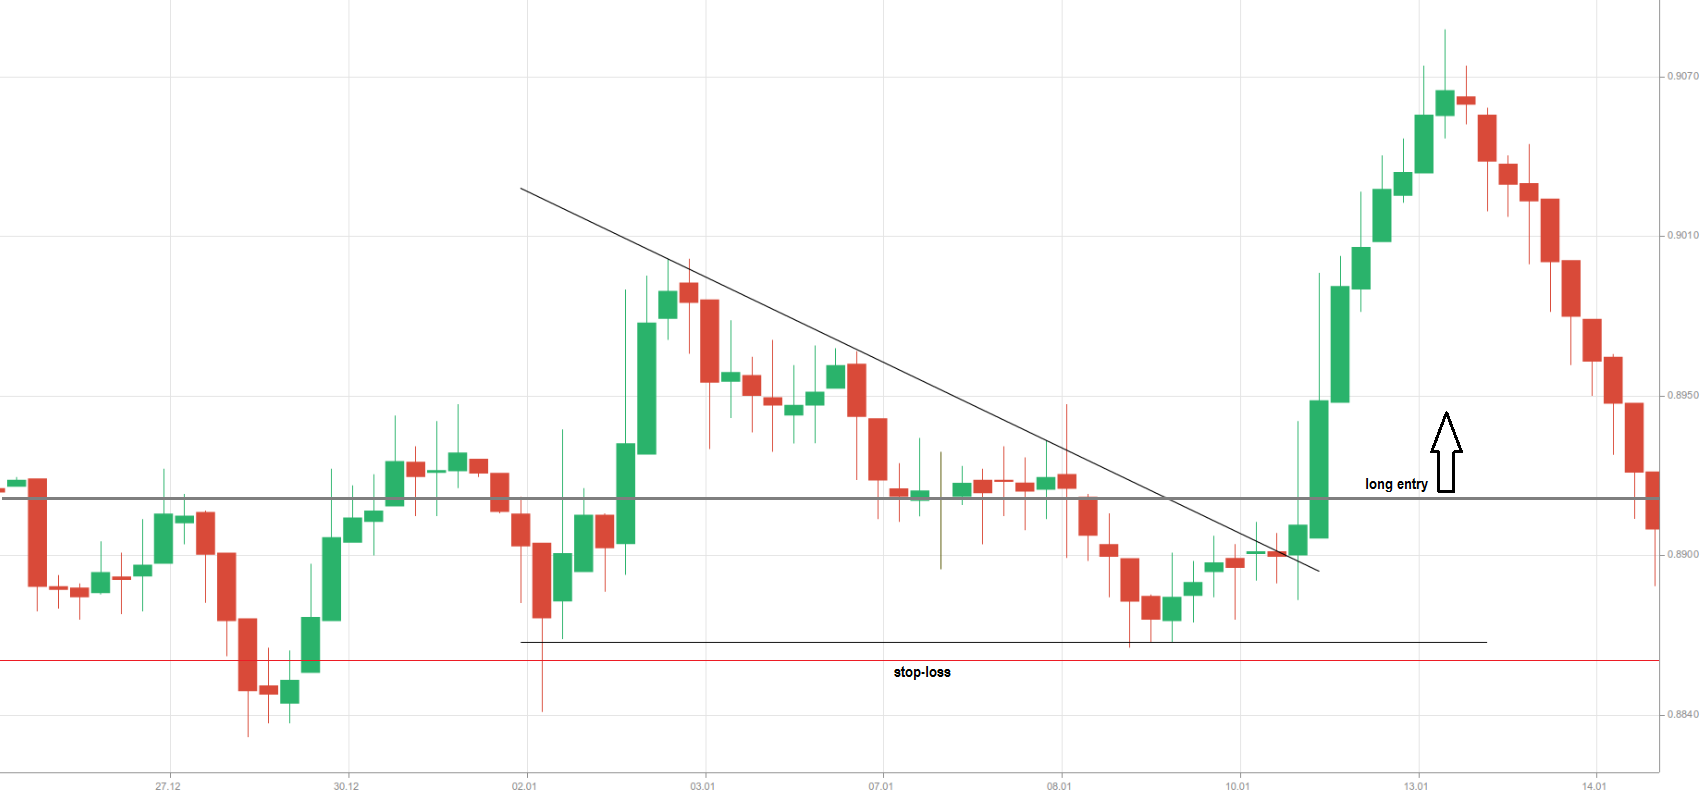
The 4-hour AUD/USD chart above shows where the protective stop was placed when trading this descending triangle formation.
The profit target, when trading any type of triangle, is measured as follows:
1. Subtract the low price of the triangle from the high price; the result is a positive value. The high and low are the points where each boundary begins, although this is not always precise.
2. If the breakout is to the upside, add this positive value to the price at which the resistance level was broken. This yields the upside target.
3. If the breakout is to the downside, subtract the positive value from the price at which the support level was broken to obtain the downside target.
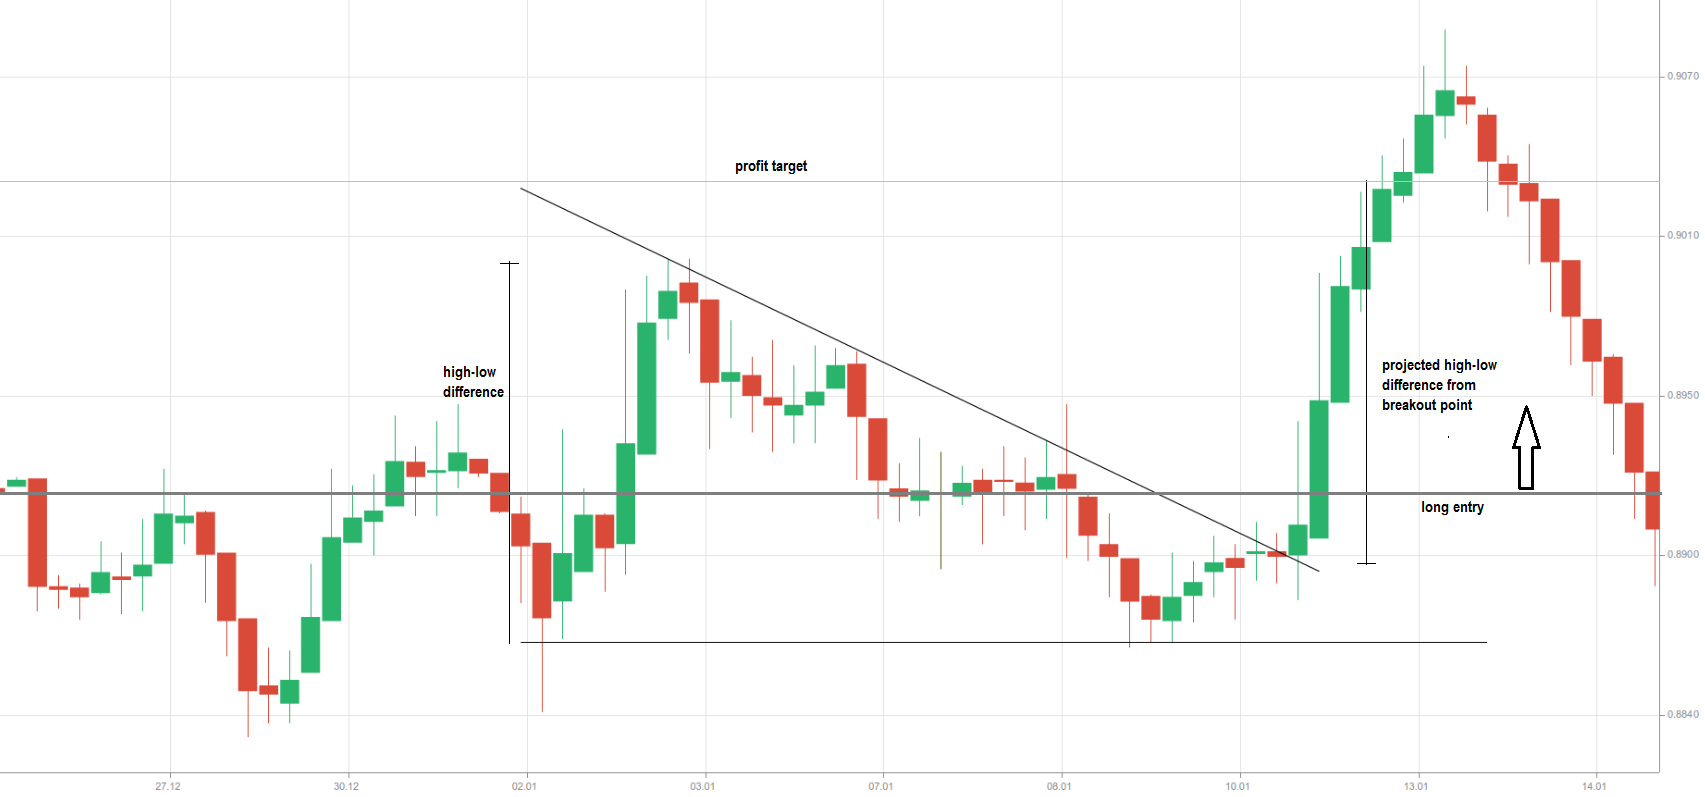
The 4-hour AUD/USD chart above shows where the profit target was placed when trading this descending triangle pattern.