Support and Resistance, Part II
This lesson will cover the following
- How to trade support and resistance levels
- Other types of support and resistance
- Breakouts and false breakouts
- How support and resistance levels can switch roles
Trading support and resistance
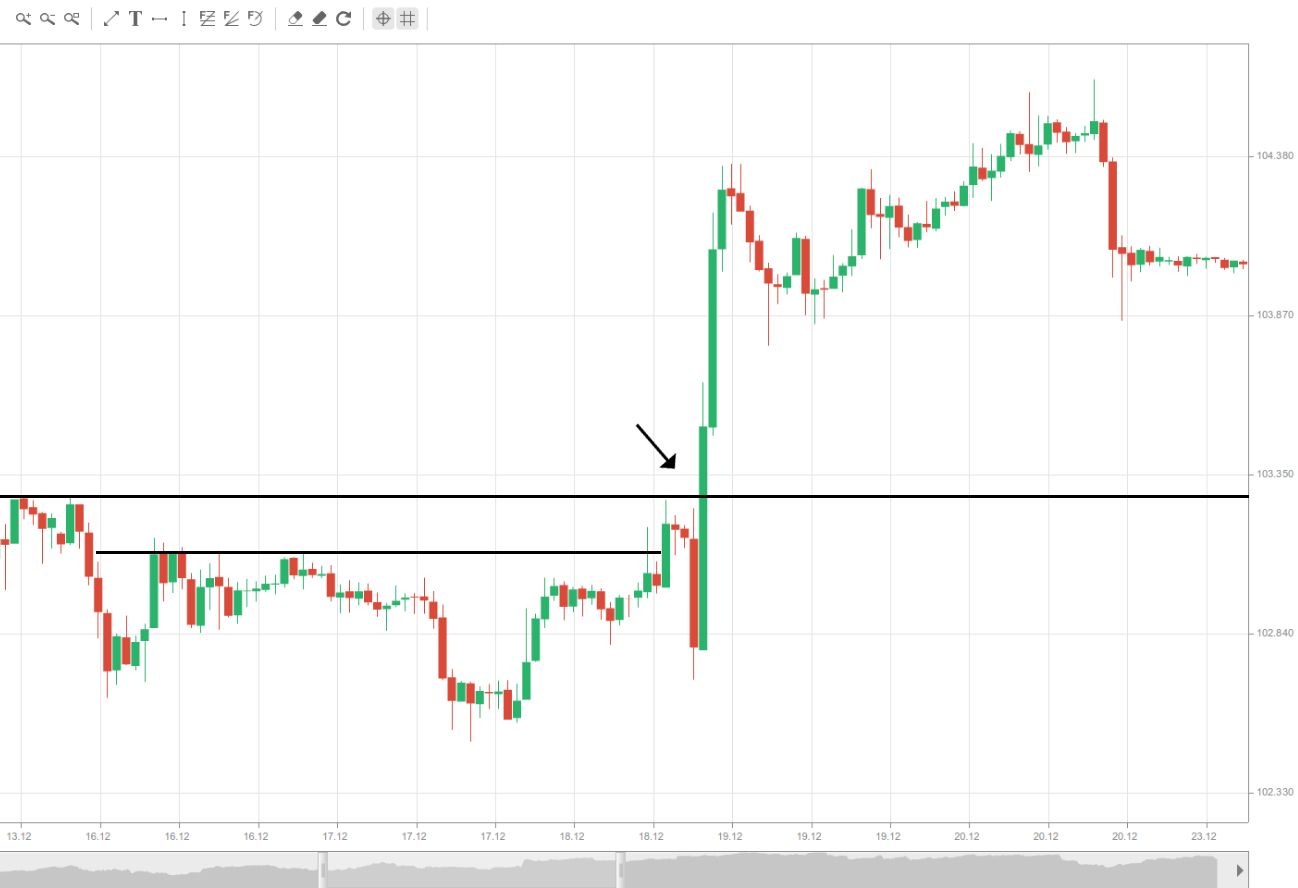
 Support and resistance levels are very often used by traders to provide a signal of when to enter or exit a trade. Because they are widely recognised as key points of price reversal, it is common for prices to rebound after hitting a support level, provided you have defined it correctly. Such a scenario is illustrated in the screenshot below.
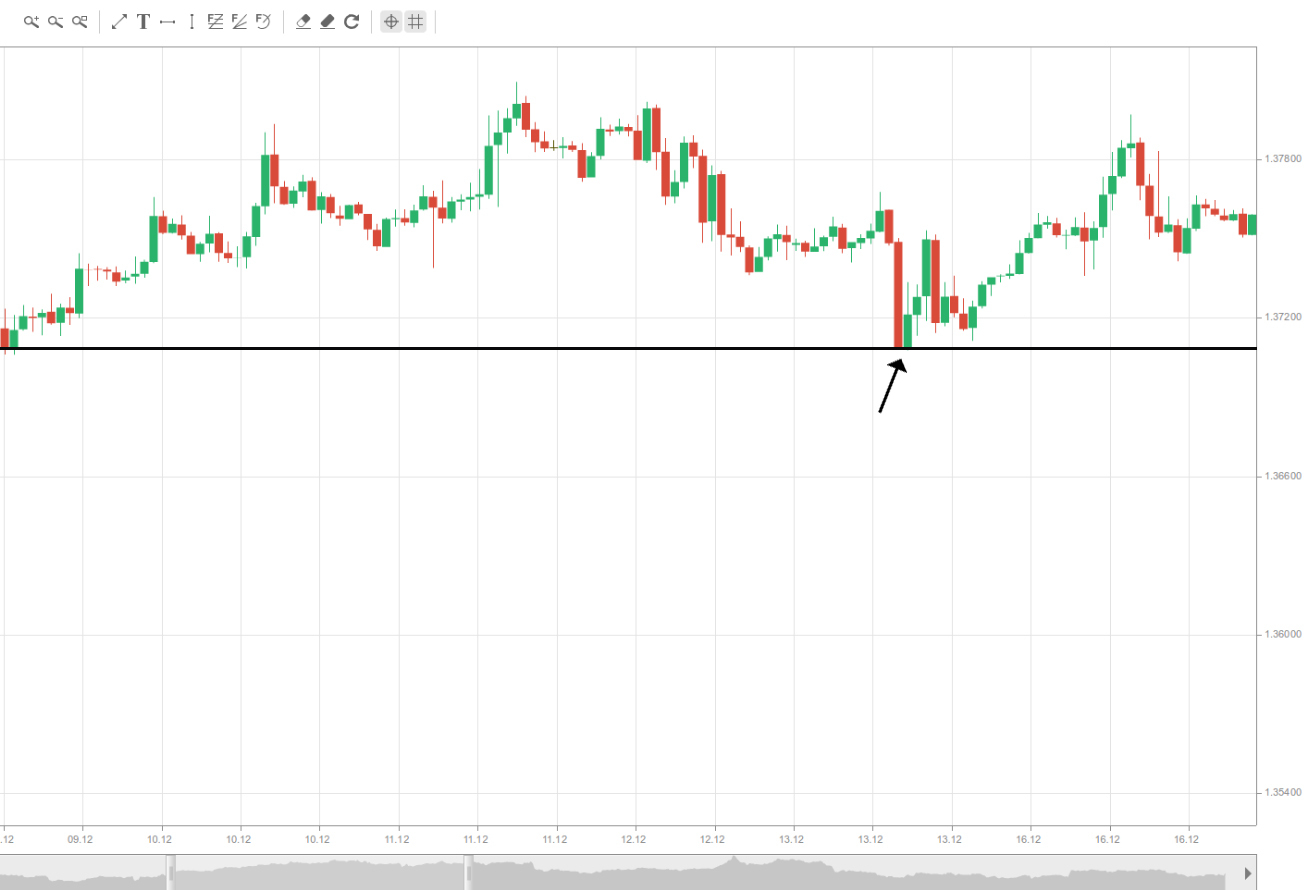
As you can see, the price rebounds from the support level and begins to rise, giving us a signal for a long entry. Logically, this tactic also works the other way around. As prices rise and eventually reach the “ceiling”, they will most likely bounce off the resistance and correct, provided there is no breakout.
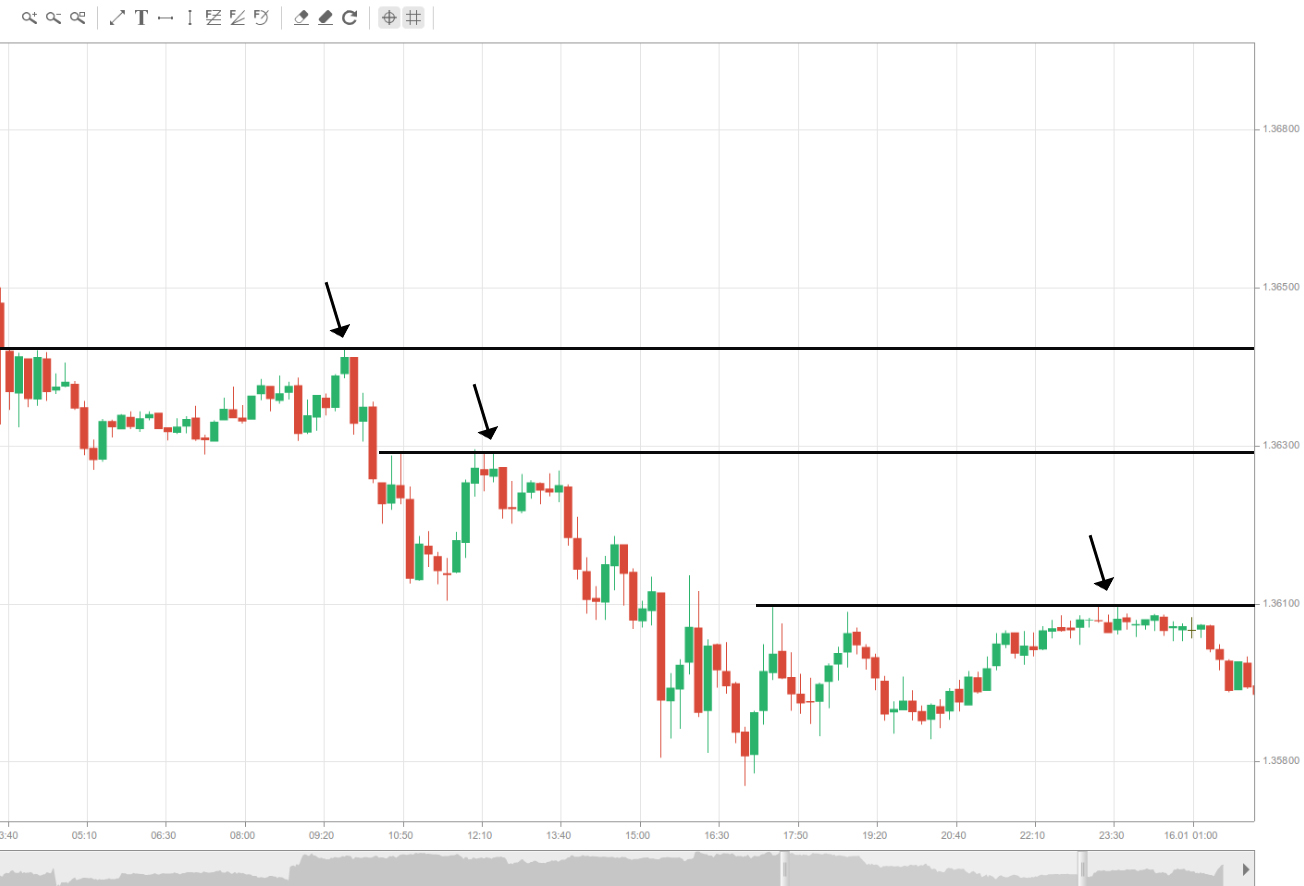
In the screenshot above you can see that the market bounced off the first level of resistance and retreated, followed by rebounds at a second and a third level of resistance, after which further declines occurred.
- Trade Forex
- Trade Crypto
- Trade Stocks
- Regulation: NFA
- Leverage: Day Margin
- Min Deposit: $100
Other types of support and resistance
 Apart from significant peaks and troughs, we’ve already mentioned that other levels can act as support and resistance as well, such as whole numbers and the upper and lower boundaries of channels, etc. However, this is not all.
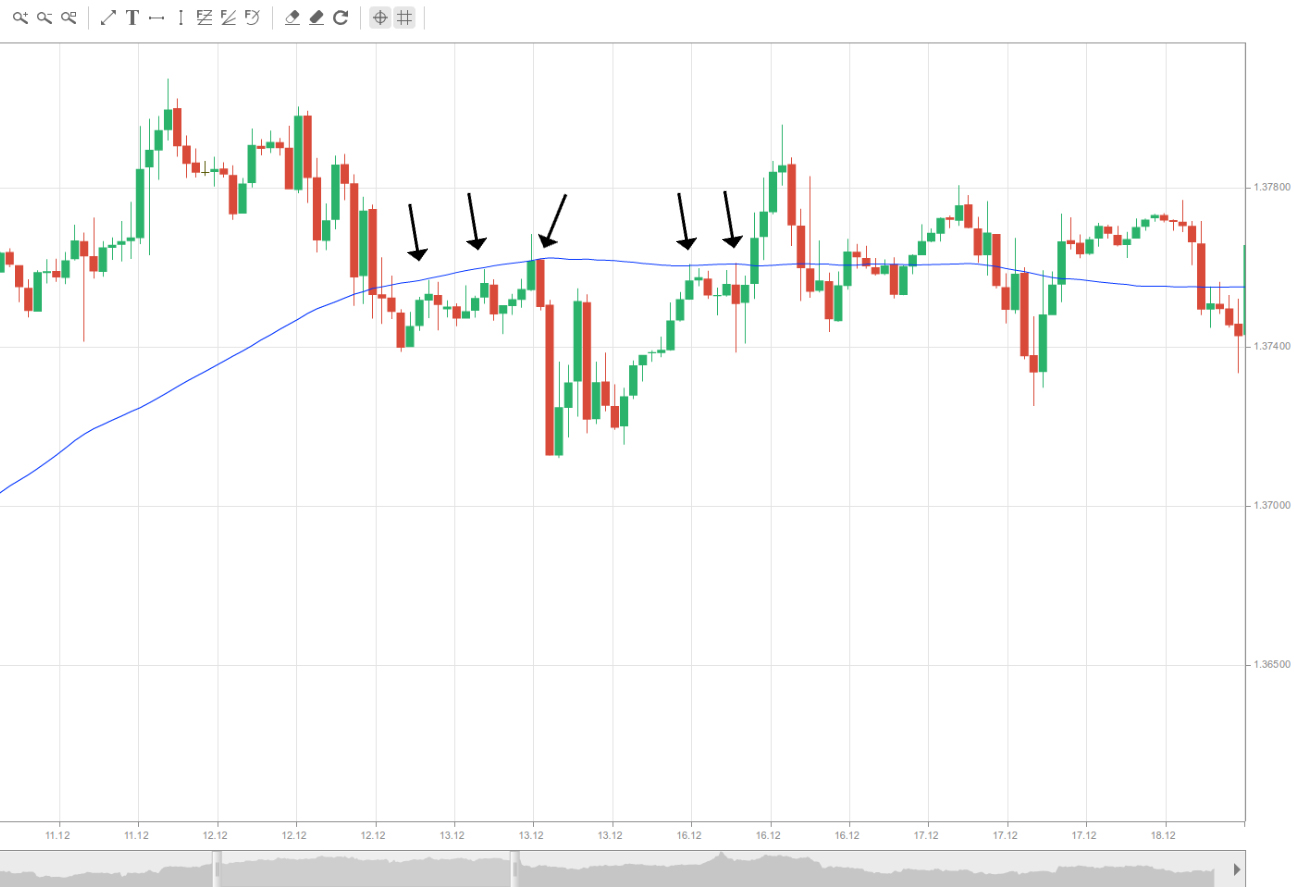
Moving averages can also play the role of support and resistance levels. Usually, falling prices tend to rebound when they hit a moving average from above; however, when they manage to break through it, a strong sell signal is generated.
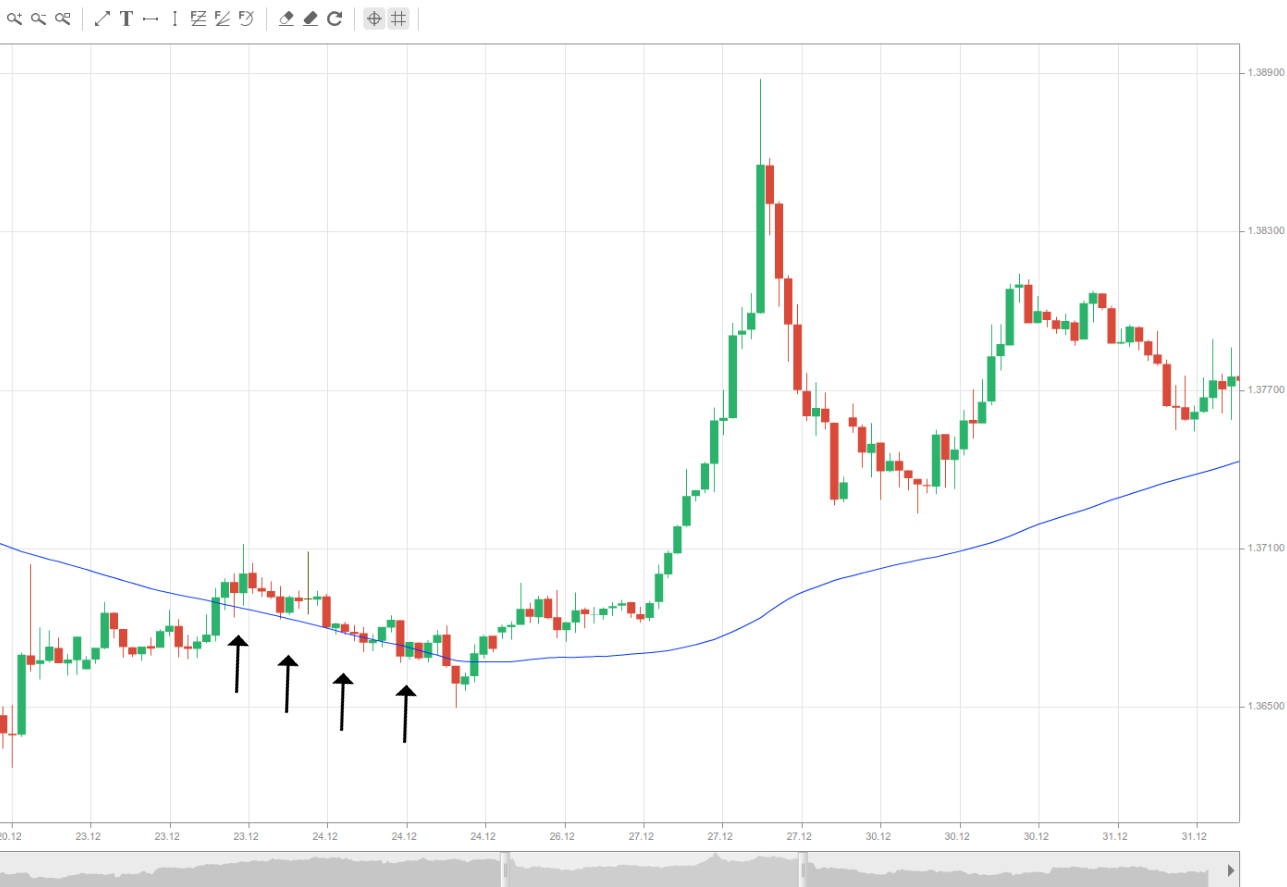
Conversely, rising prices tend to encounter resistance when approaching a moving average from below, and a buy signal is usually generated if they manage to penetrate it and continue to advance.
In addition to all of the levels listed above that can act as support and resistance, pivot points also play a role in price movement. They will be thoroughly explained in the chapter’s next article, “Pivot Points”.
Breakouts and false breakouts
 As we’ve already mentioned, although support and resistance levels are likely to cause a price reversal, in many cases the momentum is so strong that it penetrates these levels and a so-called breakout occurs.
We’ve said that near a support or resistance level a battle is waged between buyers and sellers, and once the price swings back or moves beyond the established level we learn the outcome. Once prices break out of the trading range, we know that, if the asset is rising, buyers have taken control, or if it is falling, sellers have prevailed. This generates a signal in both cases and allows us to set a profit target before the next support or resistance level.
![]() It is often observed that the longer a level holds and the more failed attempts there are to break it, the stronger the move will be after the breakout finally occurs.
It is often observed that the longer a level holds and the more failed attempts there are to break it, the stronger the move will be after the breakout finally occurs.
Another general rule of thumb is that the more times prices test a level, the weaker it becomes and the more likely it is that the level will eventually be broken. This is because each price reversal is due to traders who bet against the market. As that specific price level (for example, resistance) is revisited more and more times, there will be fewer people (sellers) willing to bet against the market, thus allowing their counterparties (buyers) eventually to overcome them, and a breakout will occur.
Although breakout trading has been popular for many years, it continues to be a viable and profitable trading strategy. This is because breakouts are powerful signals showing the initiation or continuation of a directional trend. Here is an example of a breakout.
Sometimes, however, prices do manage to penetrate a support or resistance level, but a retracement follows shortly afterwards, rendering the breakout false. We’ve mentioned earlier in the article that usually a support or resistance level is not deemed broken if there is no candle or bar that closes outside the respective level after penetrating it. In some cases, prices fall back below the broken resistance or pull back above the support even after several candles have closed. Such a scenario is visualised in the following screenshot.
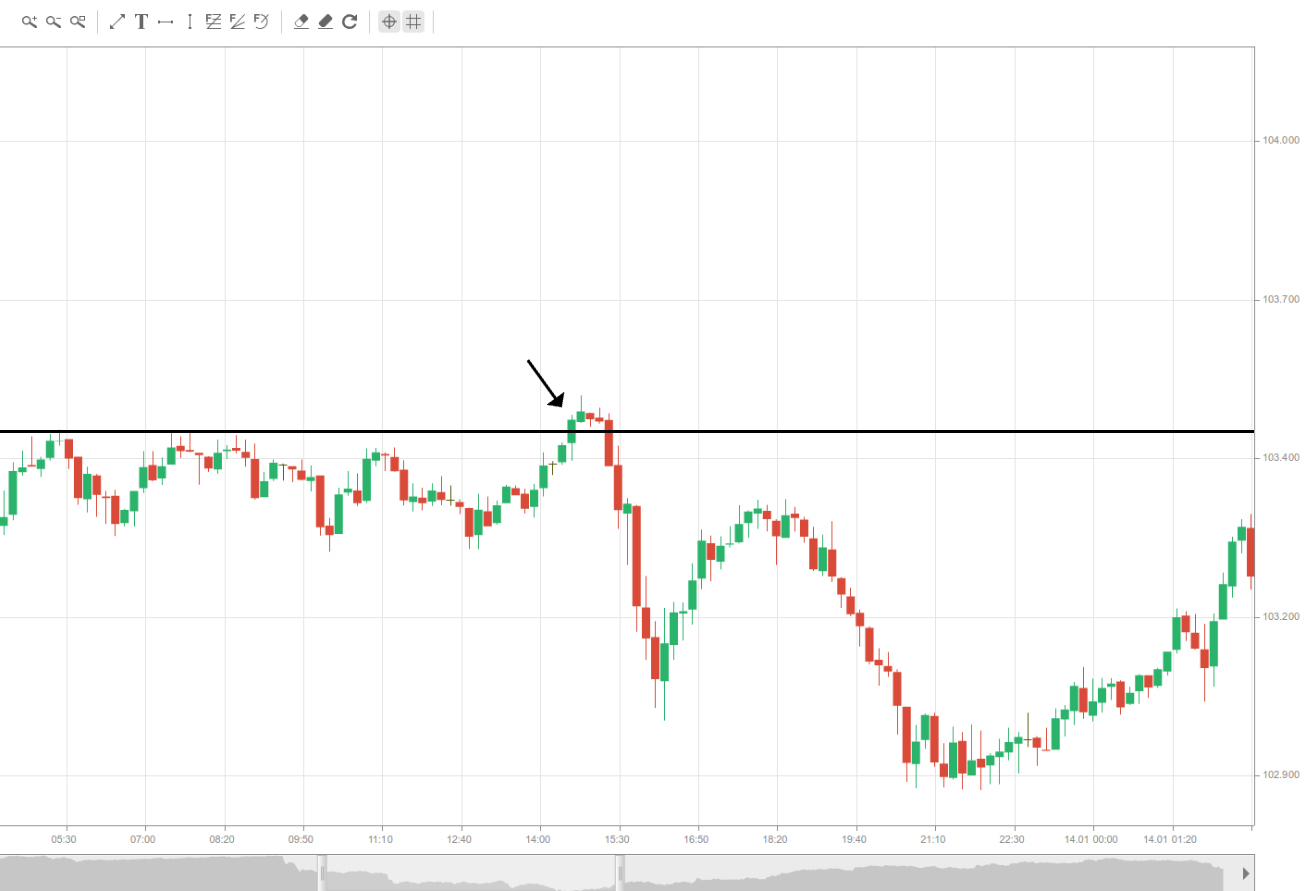
If a trader wants to use the long-entry signal generated by a resistance penetration, but still wishes to protect themselves from a false breakout, it is wise to wait until the previously established resistance level switches roles and begins to act as support. Logically, this works the other way around as well.
Resistance can become support and vice versa
 It is not uncommon for prices to return to the breakout level before they continue. In this way a resistance can begin acting as support and vice versa. The following example illustrates this case.
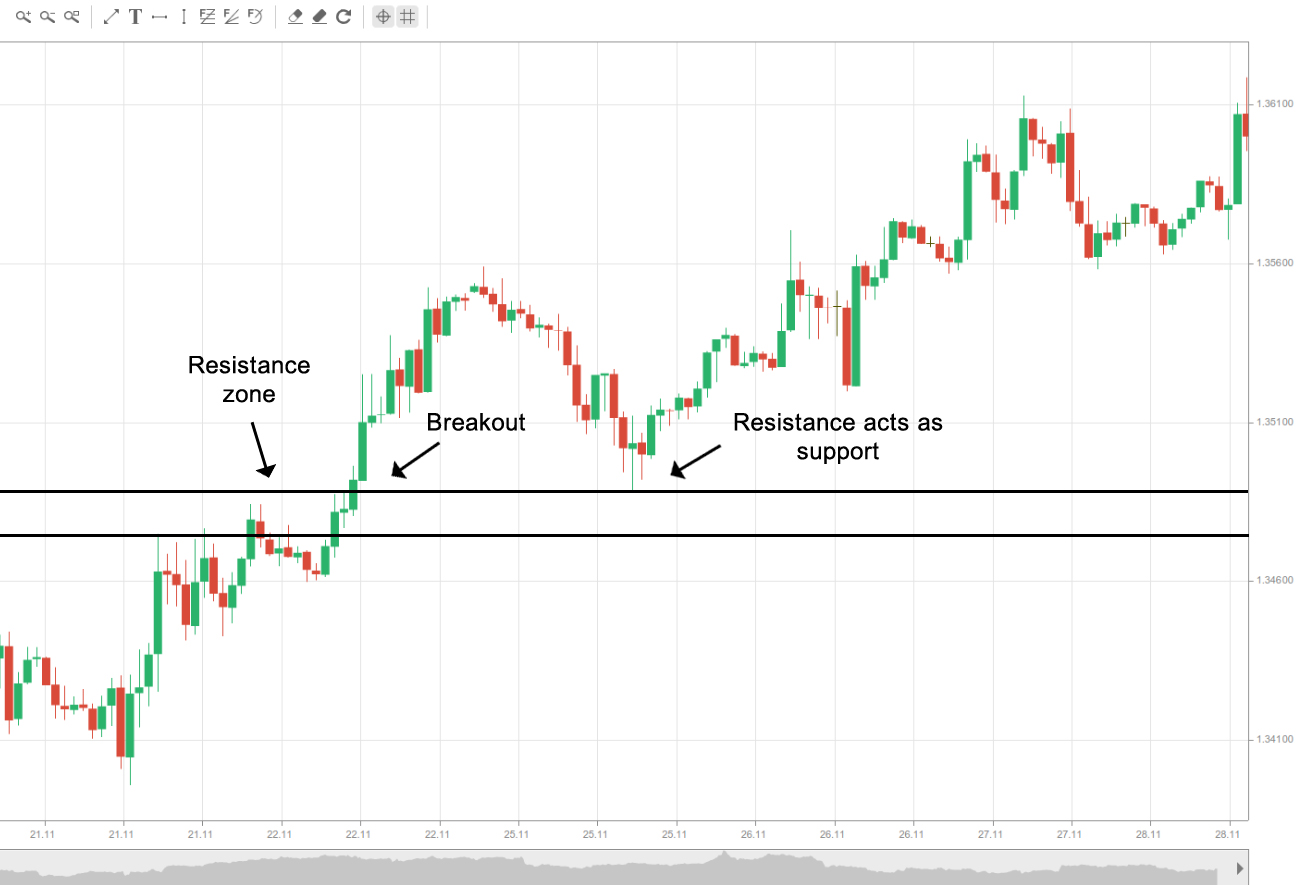
You can see that the price had found resistance in the respective zone, but eventually that level was broken. Those who did not anticipate a breakout and went short just before it accumulated losses as prices surged and broke the resistance level. However, as the price fell back to the previously defined resistance level, those traders who had gone short wanted to close their positions after their losses were minimised. Because closing a short position actually means buying the asset, they brought buying pressure back to the market, thus pushing prices up.
As soon as other market participants who haven’t entered the market yet see that the previously established resistance level has begun acting as support, they place long-entry orders (because what they saw was a rebound from support – a bullish signal). This additional buying pressure, coupled with short covering, further lifts the price and could lay the groundwork for the initiation of an upward trend.
Similarly, a support can become a resistance once the price has broken below it, and both long exits and short entries apply downward pressure.