Support and Resistance, Part I
This lesson will cover the following
- What is support
- What is resistance
- How to plot them
- What are support and resistance zones and how to determine them
- Why do you need to avoid range trading as a novice trader
Support and resistance levels are among the most important factors in trading, closely followed by both technical and fundamental analysts. Given the vast number of market participants who use signals generated by support and resistance levels, and the impact of their trade entries on the asset’s price, it is clear that no novice trader should ignore this key tool.
Support and resistance levels are price levels of utmost importance, based on historical data and used by traders to identify where future price movement may stall and reverse. They extend through time and act as psychological barriers for those who use them, but it is also common to see them switch roles once they have been broken.
Support
 A support level is the lowest point of a price’s downward movement, generally a single trough. It is the level at which selling meets buying “support” as buyers enter the market and price action loses momentum. At this point, the buyers’ energy has equalled that of the sellers. As buyers grow stronger and eventually overcome the sellers, the price will reverse and rebound.
This often-recurring sequence of events is regarded by most market players as a signal to enter a long position, or as a price target for previously opened short positions.
- Trade Forex
- Trade Crypto
- Trade Stocks
- Regulation: NFA
- Leverage: Day Margin
- Min Deposit: $100
Resistance
 Resistance levels are, logically, the opposite of support. As prices continue to rise, they will eventually hit a “ceiling” – a point where the buyers are equally matched by the sellers. As soon as the sellers overpower the buyers, the price will bounce back from the resistance level. As with support levels, but in the opposite direction, this would generate a signal for a short entry or mark a suitable price target for previously opened long positions.
How to identify and draw support and resistance levels
 In order to recognise a support or resistance level, you need to look for each significant trough or peak on the chart, or a certain level where prices have repeatedly halted their movement and reversed. Such a scenario is visualised on the following screenshot.
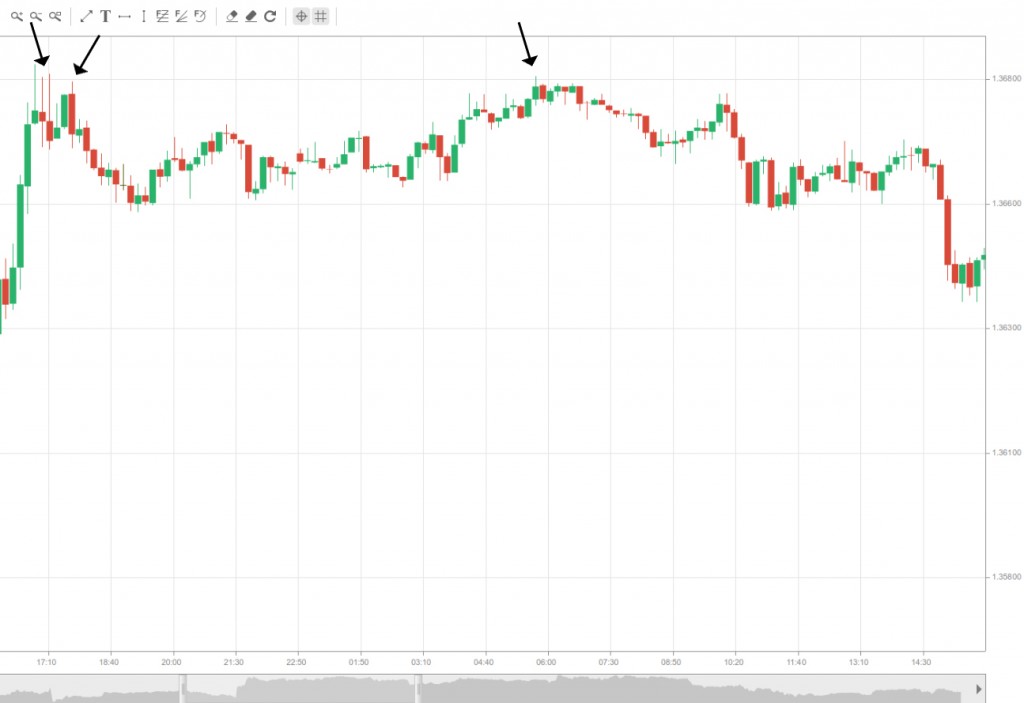
As you can see above, indicated by the arrows, the market’s upward movement was halted and reversed at several points, thereby forming resistance levels.
The next screenshot illustrates the opposite case – a price level which has reversed a price decline several times and seems to act as a support level.
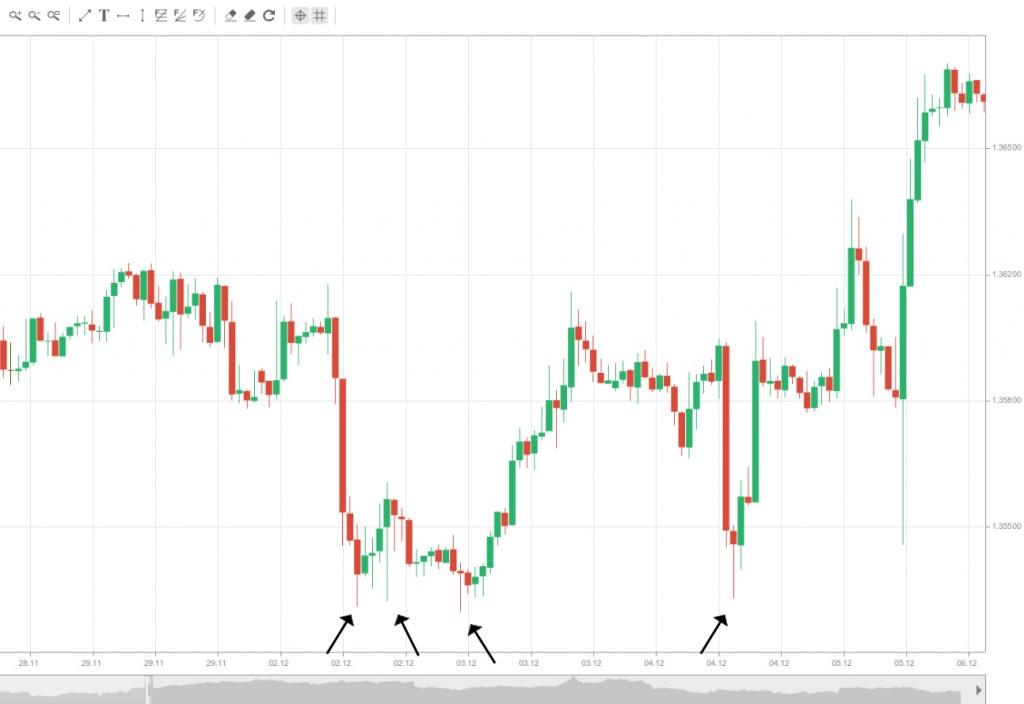
As shown above, again highlighted by the arrows, prices have fallen multiple times to certain levels, after which a rebound followed, effectively playing the role of support.
Having established our support and resistance levels, we now have to visualise them for further use. To do that, simply draw a horizontal line through the already defined price level at which the price movement encountered strong resistance and reversed, as illustrated below.
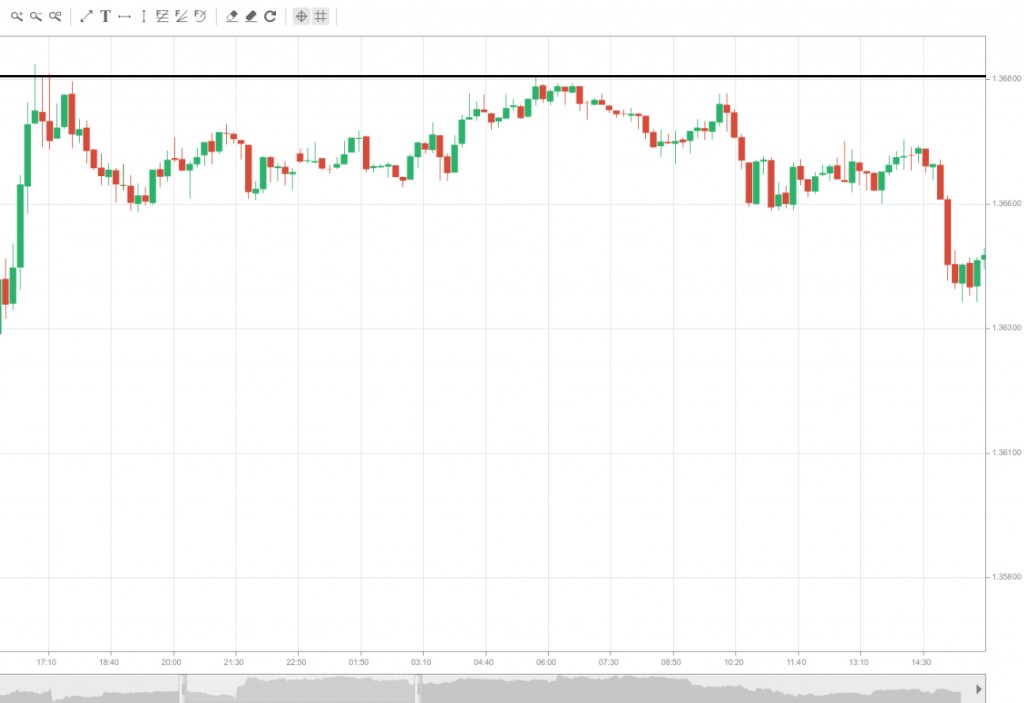
These lines should also be extended into the past in order to see if earlier price movements reversed at exactly the same level.
Support and resistance areas
 You won’t often see price movement stopping at exactly the same level, to the pip. Volatility spikes and random noise rarely allow prices to rebound from a precise support or resistance twice, which is why support and resistance areas are deemed much more popular.
A support level becomes a support zone when another support forms roughly at the same price, thereby making it harder to penetrate. It’s the same with resistance levels.
However, as with all other price data, support and resistance levels vary across different time-frames. The larger the time-frame, the wider the area will be. For example, on a monthly chart the support or resistance zone might be as much as 100 pips wide, while on time-frames shorter than 10 minutes they hardly exceed 10 pips.
Determining support and resistance zones
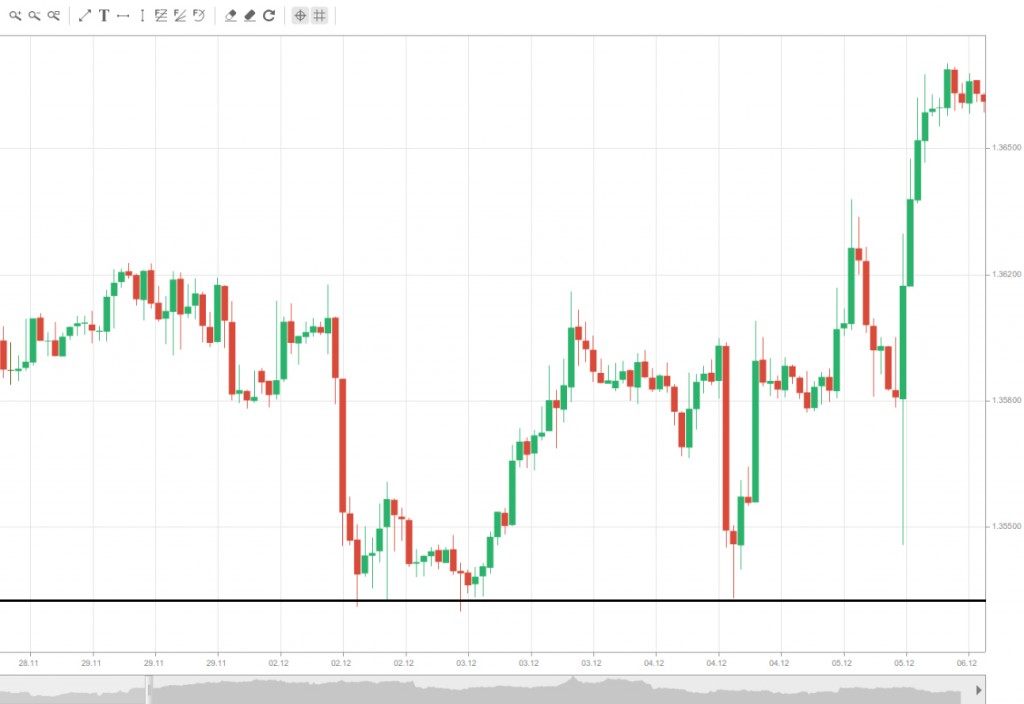
 As we said earlier, reversals usually don’t occur at exactly the same precise level, but within areas. In order to identify a support/resistance zone, you need to draw a horizontal line through each significant trough and peak into the future. When several lines – at least more than two – cluster together within a relatively small price range, we can consider this a support or resistance zone. The zone is basically the space between the highest and lowest horizontal line in our defined area, as shown in the following screenshots.
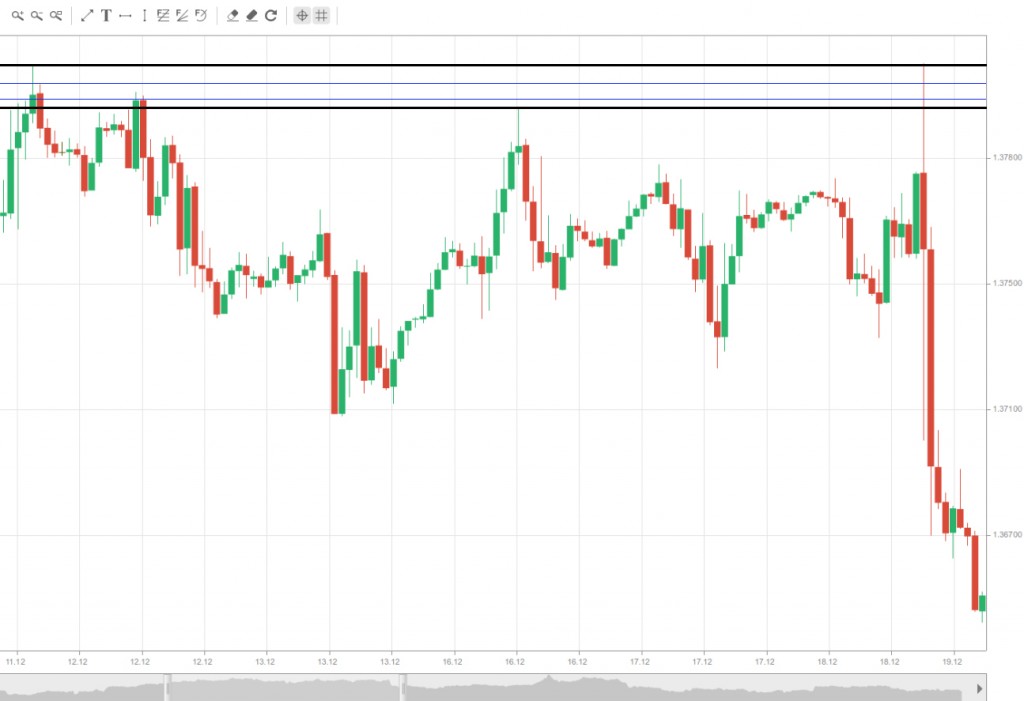
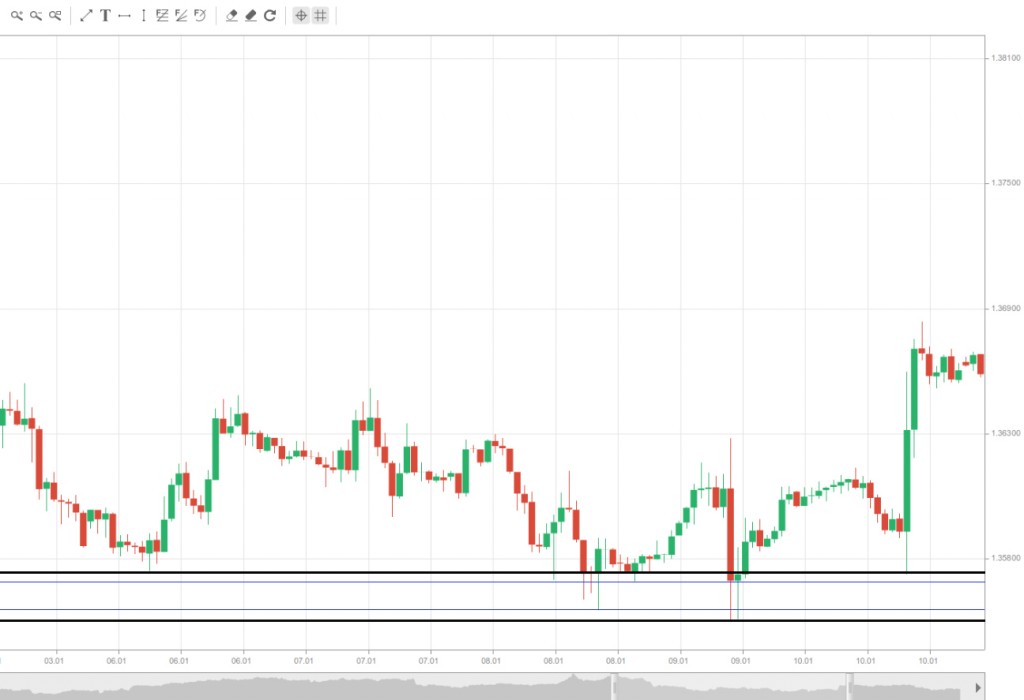
The picture above visualises a resistance area ranging between the two outer black lines, while the following shows a support area captured between the black lines.
A single horizontal line through a trough or peak with no others near it will likely act as an independent support or resistance. Such levels usually do not have the same resilience in the future as a congestion of several lines within a relatively small area, and are therefore much easier to break unless accompanied by extraordinary volume.
Prices tend to enter support/resistance areas and halt their momentum, occasionally even at a single level. Most often they will not break out through the outer horizontal line, but in some cases a breakout will occur, which usually dramatically shifts the current market situation.
![]() It is also worth mentioning that simply penetrating a support or resistance level does not always mean that the zone has been broken. It depends on the depth of penetration and, more importantly, the follow-up. A general rule of thumb to assess whether a support/resistance level is still valid is if the market, or more particularly a bar or candle, has closed below or above the respective level. If prices almost instantly pull back, then most likely the market is just testing this level and it is still credible. Such a situation is pictured on the screenshot below.
It is also worth mentioning that simply penetrating a support or resistance level does not always mean that the zone has been broken. It depends on the depth of penetration and, more importantly, the follow-up. A general rule of thumb to assess whether a support/resistance level is still valid is if the market, or more particularly a bar or candle, has closed below or above the respective level. If prices almost instantly pull back, then most likely the market is just testing this level and it is still credible. Such a situation is pictured on the screenshot below.
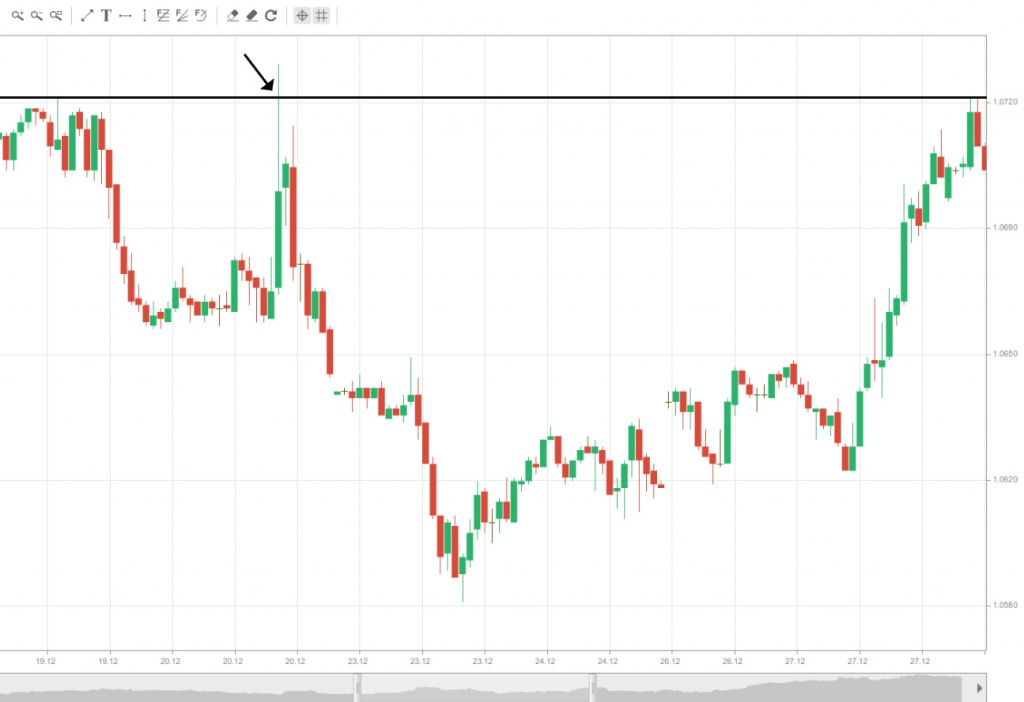
There are, of course, exceptions to this principle. Sometimes a false breakout occurs and a few candles close above the resistance or below the support zone. This will be explained later in the article.
Round numbers
 Another fact worth considering is that round numbers, such as EUR/USD 1.3500, 1.3200 and especially 1.3000, tend to act as support and resistance levels as well.
As prices approach these levels, volumes are likely to increase, particularly in the case of a breakout. This is something you need to take into account when placing protective stops, so as not to be caught off-guard as well.
Range trading
 Very often there won’t be a distinct price movement and the market will be moving sideways, or in a range. Although the principle of defining support and resistance levels in a ranging market is the same as with a trending market, sideways trading is very tricky for the novice trader to profit from.
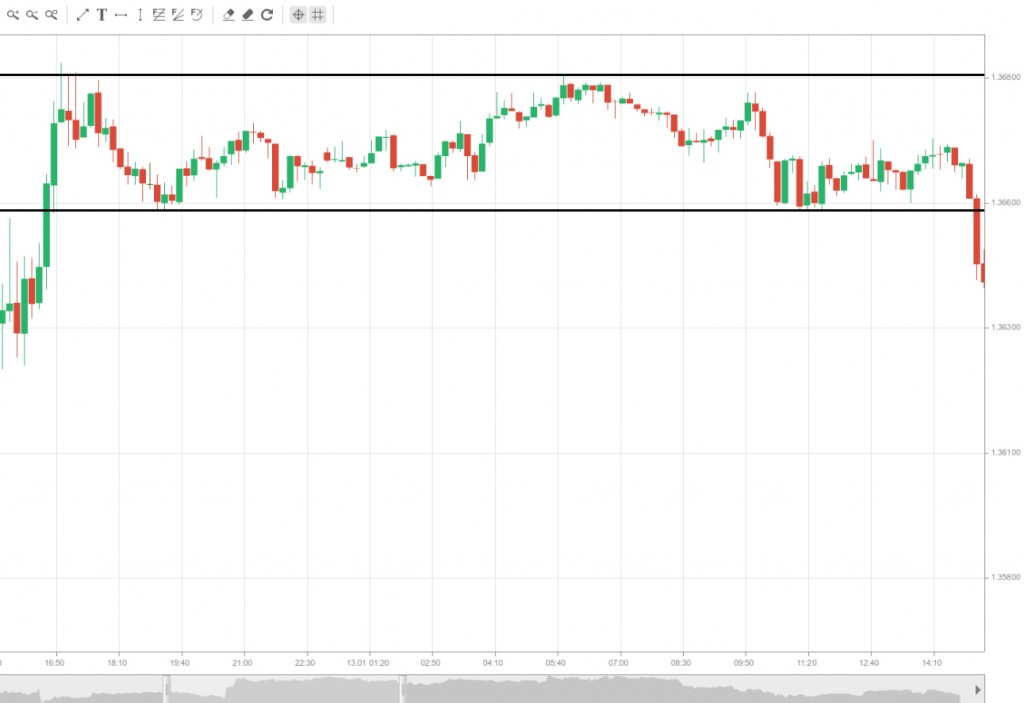
In the ranging market pictured above, you can clearly see how the resistance level provides an upper boundary of the price movement, while the support gives us the lower boundary. Very often, prices tend to bounce between the two outer horizontal lines multiple times, because market sentiment is not clear and buyers are actively fighting the sellers – it’s a ranging market. Eventually, however, just like a trending market, a breakout with a certain strength will occur and prices will later consolidate at a different level.
![]() However, trading within a range is deemed very difficult and although many sources suggest it is a viable strategy, entry and exit points are very hard to determine. The first difficulty you will encounter is actually recognising that prices are ranging before a considerable amount of trades and time have passed. This means that the entry opportunities are largely recognised in retrospect, which makes this trading strategy less efficient than others.
However, trading within a range is deemed very difficult and although many sources suggest it is a viable strategy, entry and exit points are very hard to determine. The first difficulty you will encounter is actually recognising that prices are ranging before a considerable amount of trades and time have passed. This means that the entry opportunities are largely recognised in retrospect, which makes this trading strategy less efficient than others.
Second, because the boundaries of the trading range are often zones rather than precise prices, the entry points of your trades and your price targets are practically indefinite, thus adding to a novice trader’s headaches.
Third, because entry and exit points are harder to define, this also increases the difficulty in placing your protective stops, which could effectively reduce your possible profits or increase losses.
And last but not least, all these tough decisions increase the time you need to execute trades. When you consider the first negative aspect, which we mentioned above, this renders ranging markets even more inadvisable for inexperienced traders, who most often await an eventual breakout and the beginning of a new trend.
Suitable exception
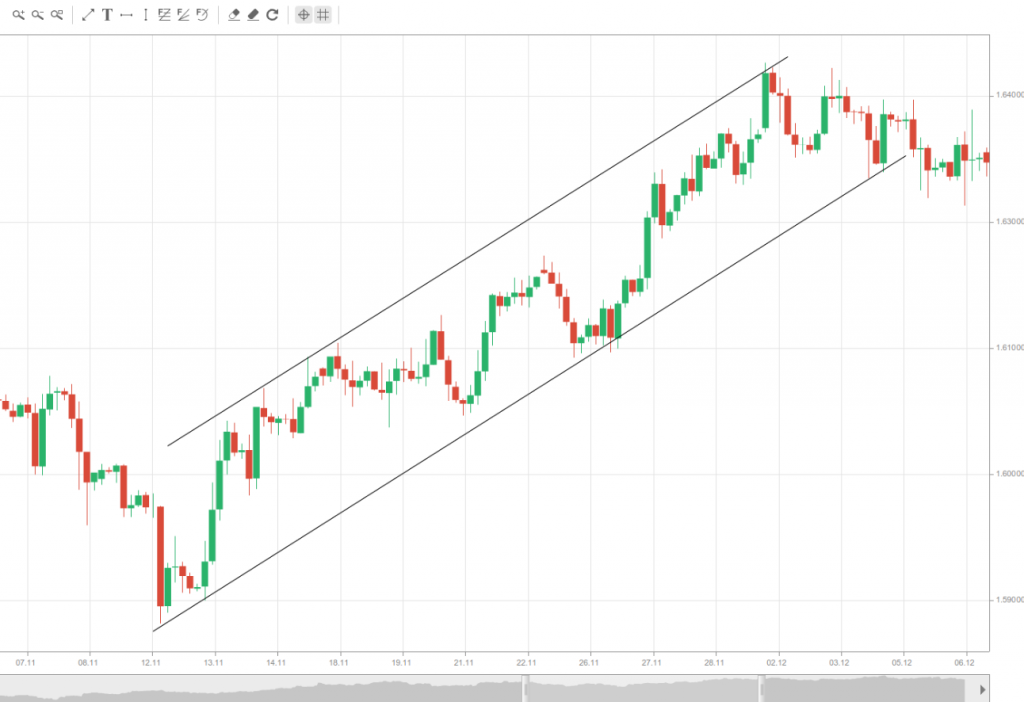
 There is, however, one exception to range trading that is considered suitable for the average market player, and that is channel trading. Channels will be explained thoroughly later in the article Channels, and for now it is sufficient to say that they represent upward- or downward-tilted trading ranges bounded by trend lines. These trend lines act as support and resistance levels, as illustrated in the following screenshot.
Remember
 A trader can trade the channel as prices bounce between the trend lines, but you should remember always to bet in the trend’s direction. If we have an upward trending channel, you should enter long positions when prices rebound from the lower boundary and exit the trade when they reach the upper one. It is inadvisable to go short when prices rebound from the upper trend line and bet against the market, because generally upward trends have longer upward subtrends and shorter downward subtrends, which reduces the overall difficulty seen in ranging markets.