Stochastic Oscillator
This lesson will cover the following
- What is the Stochastic Oscillator
- How is it calculated and visualised
- What does it tell us
- Different variations of Stochastic Oscillators
The Stochastic Oscillator is a technical momentum indicator that compares a security’s closing price to its price range over a given time period. Its sensitivity to market fluctuations can be decreased by adjusting the time period or by taking a moving average of the result.
The principle on which the stochastic is based is that, during upward trends, prices tend to close near their highs, while in a down-trend they usually close near their lows.
%К = 100 x [(C – L14)/(H14 – L14)]
C = the most recent closing price
L14 = the low of the 14 previous periods
H14 = the highest price traded during the same period
%D= 3-period moving average of %К
As with many other oscillators, the default setting for the Stochastic Oscillator is to look back 14 periods. A 14-period %К therefore uses the lowest low and the highest high over the past 14 periods, coupled with the most recent close. %D is a 3-period simple moving average of %К and is visualised beside %К to act as a trigger line, generating signals.
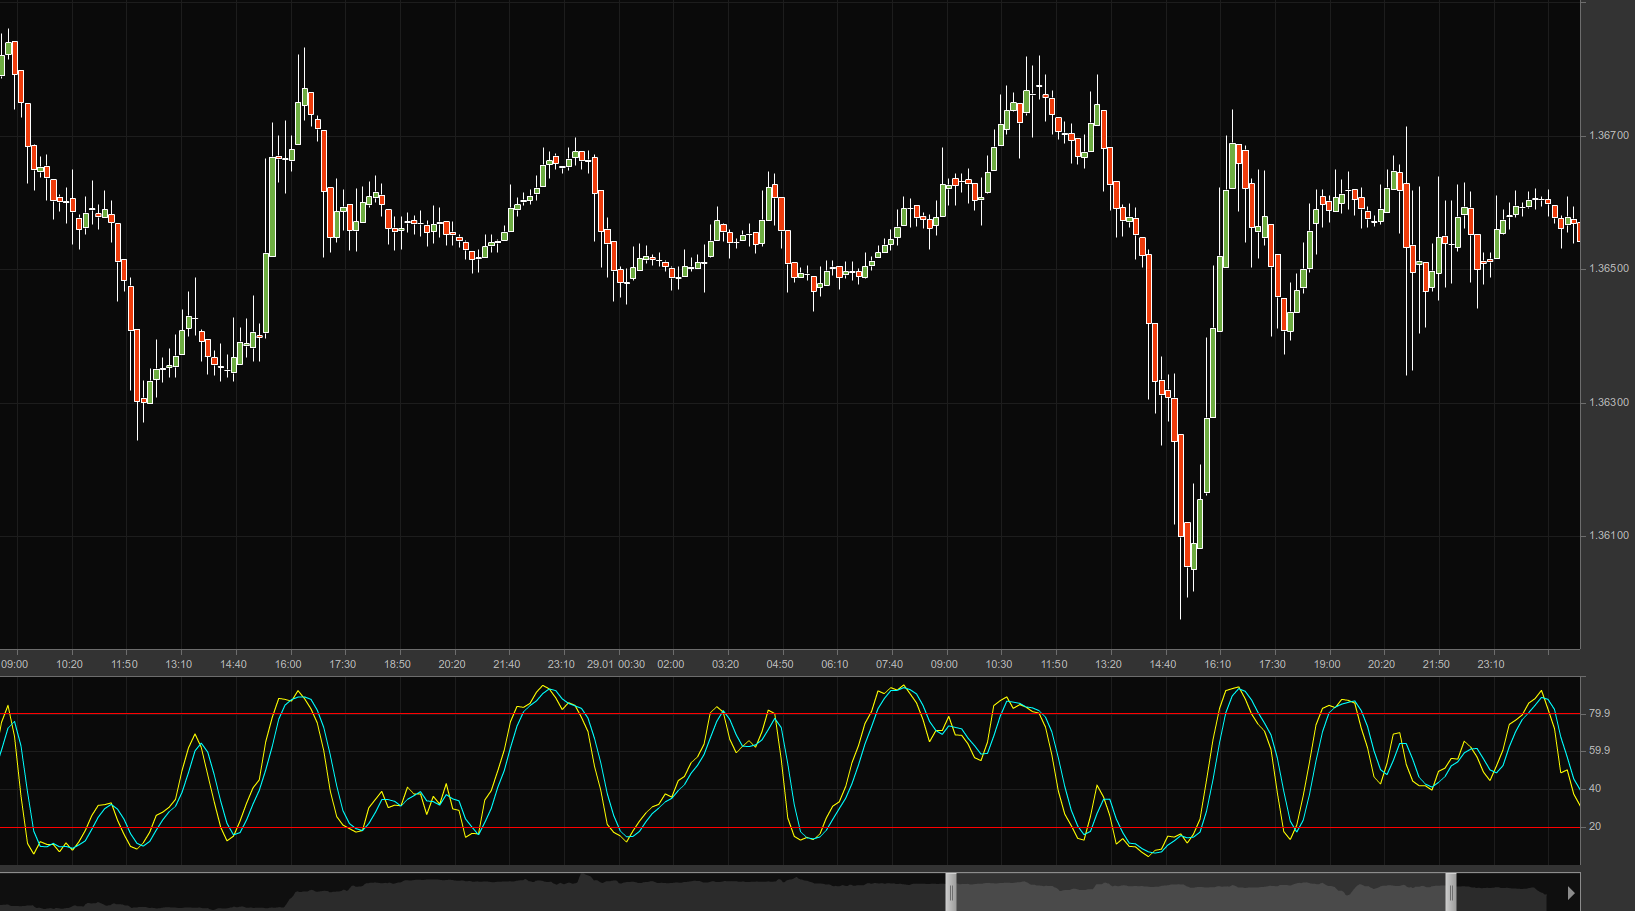
The graph above shows what the Stochastic Oscillator looks like. The yellow and light-blue lines represent %K and %D respectively, while the red lines define overbought and oversold levels.
- Trade Forex
- Trade Crypto
- Trade Stocks
- Regulation: NFA
- Leverage: Day Margin
- Min Deposit: $100
Interpretation
 As mentioned before, the Stochastic Oscillator compares a security’s closing price to its price range over a given time period. Values above 50 indicate that the close is in the upper half of the range, while values below 50 indicate the lower half. Low readings, such as below 20, signify that the price is near its low during the tracked period, while high readings, such as above 80, mean that the price is near its high during the respective period.
Overbought, Oversold
 Given the Stochastic Oscillator’s nature as a bounded indicator, it is considered very useful in helping traders identify when an asset is overbought or oversold. It is ‘bounded’ because its values are held within a range of between 0 and 100. Default settings on most platforms, including MetaTrader4, use the 80 and 20 levels as thresholds for the overbought and oversold zones respectively. However, as with most other indicators, these settings are subject to change and can be fine-tuned to meet each trader’s unique preferences.
Readings below 20 for a 14-day stochastic indicate that the asset has been trading near the lower end of its 14-day price range. Conversely, readings above 80 are observed when a security is trading near the top of its high-low range.
However, one should not base trading decisions solely on overbought and oversold levels. Keep in mind that overbought levels are not always bearish, just as oversold ones are not always bullish – it largely depends on how strong the prevailing trend is. An asset can move above the overbought threshold and remain in that area for an extended period during a strong up-trend. Price closing consistently near the top of the range reflects sustained buying pressure.
Logically, the same happens on the other side of the range, at the oversold level. Therefore, it is sensible to identify the general trend and trade in its direction, because price tends to move for longer in the direction of the trend, while corrections are usually shorter. It would then be logical to seek the relatively rare oversold readings in an upward-trending market and ignore the frequent overbought values. Similarly, one should keep an eye out for the relatively rare overbought readings during a down-trend and avoid the often-seen oversold readings.
Fast, Slow or Full
Fast Stochastic
 There are three versions of the Stochastic Oscillator. The Fast Stochastic Oscillator is based on George Lane’s original formulae for %К and %D. Here, however, %К is choppy and %D is a 3-period simple moving average of %К.
Fast %К = %К basic calculation
Fast %D = 3-period SMA of Fast %К
Slow Stochastic
 The Slow Stochastic Oscillator smooths %К with a 3-period SMA, which is what %D is in the Fast Stochastic Oscillator. Note that %К in the Slow Stochastic Oscillator equals %D in the Fast Stochastic Oscillator.
Slow %К = Fast %К smoothed with 3-period SMA
Slow %D = 3-period SMA of Slow %К
Full Stochastic

The Full Stochastic Oscillator is a variant of the slow version and is fully customisable. One can fine-tune the look-back period, the number of periods for the %D moving average and the number of periods used to smooth %К.
Full %К = Fast %К smoothed with X-period SMA
Full %D = X-period SMA of Full %К
Divergences
 A divergence occurs if a new high or a new low in price action is not confirmed by the Stochastic Oscillator. If price action records a lower low while the stochastic records a higher low, the situation is called a “bullish divergence”. This implies that downward momentum is weakening and a bullish reversal may be just around the corner.
Conversely, if price action records a higher high while the stochastic records a lower high, the situation is called a “bearish divergence”. This suggests that upward momentum is weakening and a bearish reversal may be imminent.
After a divergence occurs, technical analysts should look to confirm the signal that a reversal might actually happen. To confirm a bearish divergence, analysts should look for a support break on the chart or for the stochastic to cross below the centreline at 50.
To confirm a bullish divergence, analysts should look for a resistance break on the chart or for the stochastic to move above the centreline at 50.
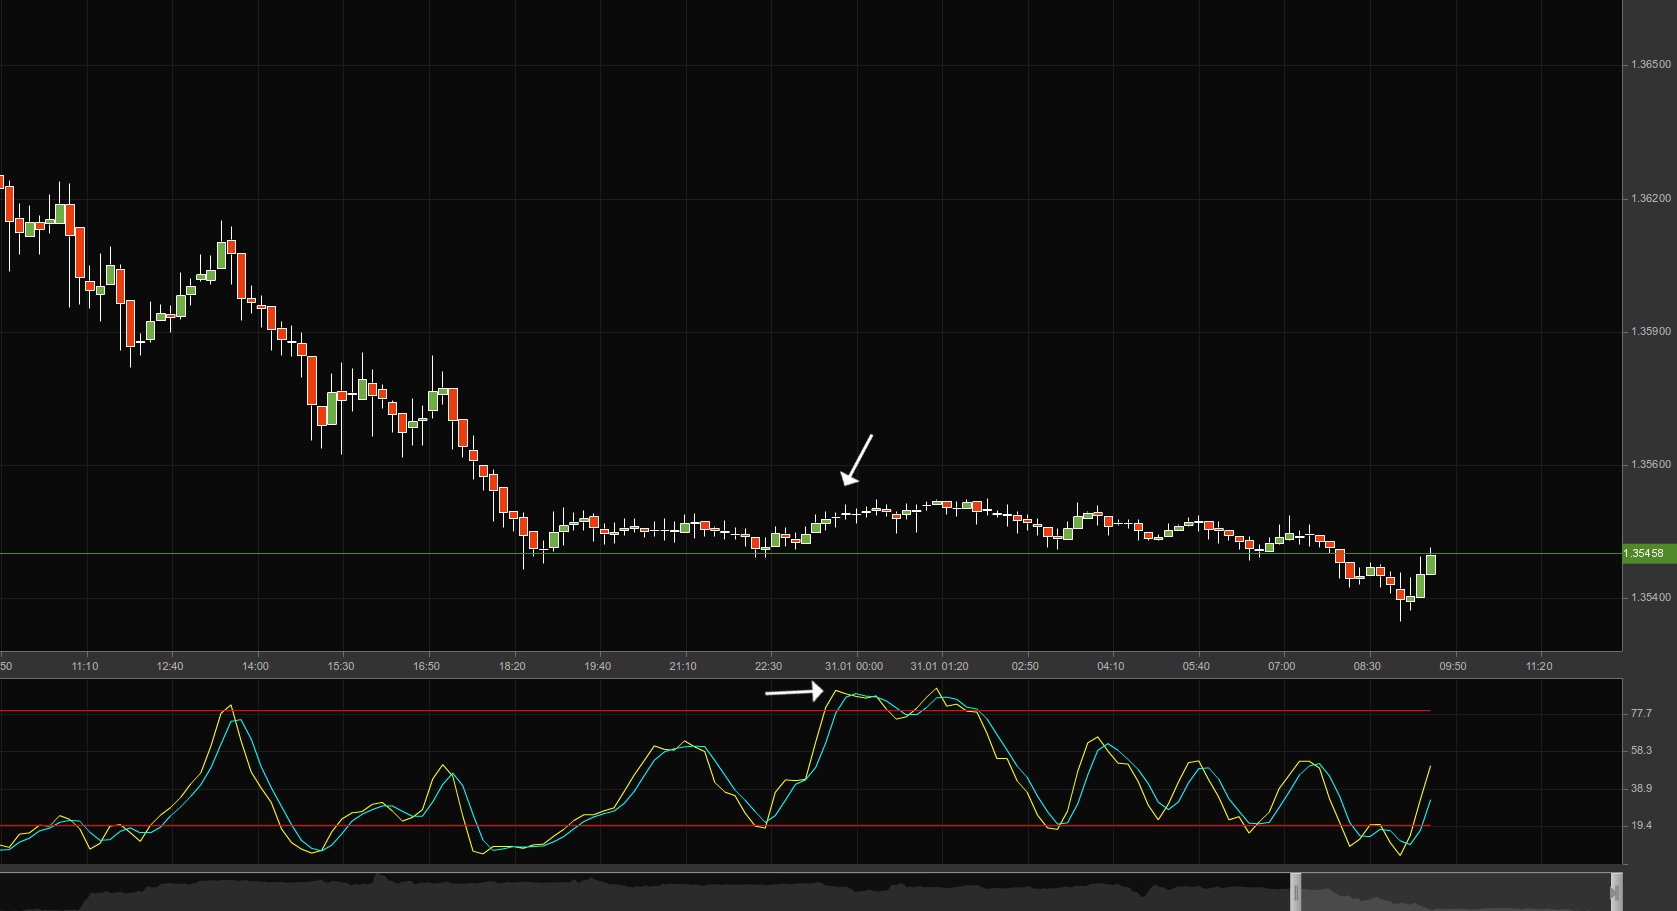
As the stochastic oscillates between 0 and 100, the central level of 50 is usually closely watched. If the stochastic moves above this central level, it is considered an indication that price tends to trade in the upper area of its high-low range during the examined period, implying a situation similar to a half-filled cup.
If the stochastic moves below the central level, it is considered an indication that price tends to trade in the lower area of its high-low range during the examined period, implying a situation akin to a half-empty cup.
Usually, indicators that gauge momentum are most appropriately used in flat markets (trading ranges). However, these oscillators can also be applied to trending instruments when the trend itself unfolds in a zig-zag manner. Pullbacks are parts of rising trends, which zig-zag upwards. Bounces are parts of falling trends, which zig-zag downwards. That is why the stochastic can be used to detect opportunities that are in harmony with the larger trend.
The oscillator is also useful for identifying reversals near support and resistance levels. If an instrument is trading close to a support level and the oscillator is oversold, one should look for the stochastic to break above the 20 level. This may indicate an upward reversal and a successful test of support.
If an instrument is trading close to a resistance level and the oscillator is overbought, one should look for the stochastic to break below the 80 level. This may indicate a downward reversal and a failed resistance test.
The stochastic is usually set according to one’s preferences, trading style and the time frame used. An oscillator with a shorter period will produce a choppier line with a greater number of overbought and oversold situations. An oscillator with a longer period will produce a smoother line with fewer overbought and oversold situations.
It is vital for any trader to use the Stochastic Oscillator in combination with other tools of technical analysis. As with other oscillators, volume, support and resistance levels or breakouts should be used to confirm or invalidate the signals provided by the stochastic.