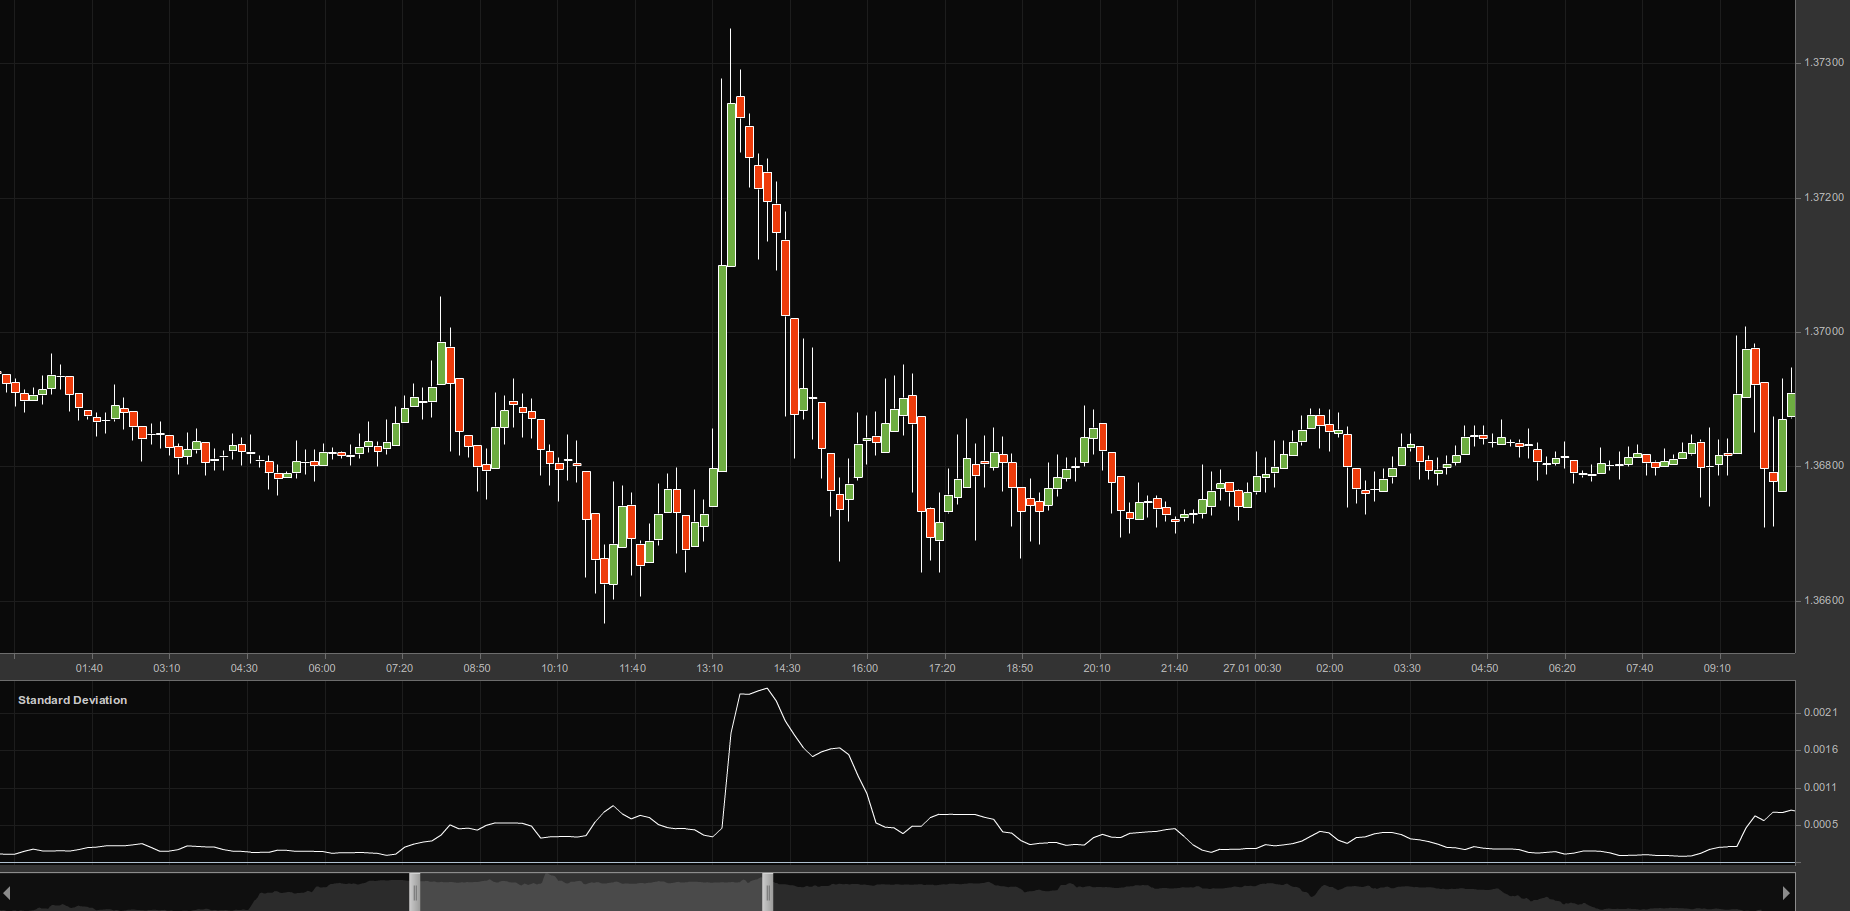
Standard Deviation Indicator
This lesson will cover the following
- What the Standard Deviation Indicator is
- How it is visualised
- How it is used
- When it should be used
 Standard deviation is an indicator that measures the magnitude of an asset’s recent price movements in order to help predict how volatile it may be in the future.
It can help you decide whether volatility is likely to increase or decrease. A very high standard deviation reading indicates that a large price change has just occurred, but that a decrease in volatility could soon follow. A very low standard deviation reading indicates the opposite.
The standard deviation indicator forms part of the calculation of Bollinger Bands, and is practically synonymous with volatility.
This indicator measures the scale of price deviation relative to the moving average. This means that if the indicator’s value is large, the market is experiencing high volatility and candlesticks are widely dispersed. Conversely, if the value is smaller, market volatility is low and prices remain close to the moving average.
The standard deviation indicator is easy to interpret because it reflects market behaviour, which alternates between highly active and sluggish conditions. If standard deviation is too low, i.e. the market is exceedingly inactive, it makes sense to expect a spike soon. Conversely, if the value is extremely high, a decline in activity is likely to follow.
- Trade Forex
- Trade Crypto
- Trade Stocks
- Regulation: NFA
- Leverage: Day Margin
- Min Deposit: $100
Use of the Standard Deviation Indicator
 Using probability distribution models allows you to create many trading strategies, but the most common application of the standard deviation indicator is to predict price reversals based on the principle of reversion to the mean.
Retracement to the mean is essentially the principle on which oscillators such as the Relative Strength Index are built. It suggests that every deviation from the mean must be followed by a return to it, so that the overall distribution of prices conforms to the normal distribution.
When to Use Standard Deviation
 Standard deviation is regarded as one of the most reliable indicators available to traders, but only under certain conditions. In trending markets where volatility is moderate and price oscillation is concentrated around the middle of the range, the standard deviation indicator is among the best tools available. Many of the methods employed by hedge-fund operators and bank analysts rely heavily on normal distribution patterns.
For example, if a currency oscillates between 1.2700 and 1.3700 over an extended period, with much of the movement confined to the middle of the range, you could trade the pattern by assuming mean reversion based on the normal distribution.
Conversely, if prices are clustered at the edges of the same range – for example, around 1.3600-1.3700 or 1.2700-1.2800 – the probability distribution may not be normal, and using the standard deviation indicator while assuming mean reversion could be disastrous.
This is particularly important because it is also one of the main drawbacks when trading moving averages in general. The average price will be the same in a pattern where prices are concentrated predominantly at the edges of the range and in one where they are focused in the middle. However, these two patterns follow completely different rules. Therefore, you shouldn’t apply the same mean reversion strategy based on a single, basic reading of market movement. First, you need to analyse the distribution of prices, the range, and the long-term trend in which they occur in order to apply the standard deviation indicator correctly.