Retail sales and Personal Consumption Expenditures
This lesson will cover the following
- What retail sales are
- How traders read the retail sales indicator
- Personal Consumption Expenditures and how to read them
Retail sales in general
 Retail sales are a crucial indicator of the overall economic activity of any nation. The retail sales report reflects the dollar value of merchandise sold in the retail sector by sampling companies that sell physical end products to consumers. In the United States this report is released by the Census Bureau, which is a part of the Department of Commerce. To compile the report, the Census Bureau surveys about 5,000 companies of all sizes, from huge retailers such as Walmart to small independent family firms. The retail sales report encompasses both fixed point-of-sale businesses and non-store retailers, such as mail-order catalogues and vending machines.
The report is usually released at 13:30 GMT (8:30 AM EST) on or around the 13th of each month.
The released data cover sales during the preceding month, which means that this is a timely indicator, gauging not only the performance of retail trade in a given country, but also price-level activity as a whole. For example, in the United States consumer expenditures contribute to almost two-thirds of the nation’s total GDP.
The report usually contains two components: a total sales figure (and the related percentage change compared with the prior month) and a “sales ex-autos” figure, also known as core retail sales. The latter removes large-ticket items and the historical seasonality of automobile sales. Other volatile elements that analysts may exclude to reveal the underlying demand pattern include the prices of food and energy.
- Trade Forex
- Trade Crypto
- Trade Stocks
- Regulation: NFA
- Leverage: Day Margin
- Min Deposit: $100
How do traders read the retail sales indicator?
 The retail sales report is considered a coincident indicator, meaning that it reflects the current state of the economy. It is also viewed as a pre-inflationary indicator, which traders can use to reassess the probability of an interest-rate rise or cut by central banks.
If retail sales in the Eurozone increase considerably during the middle of the business cycle, surpassing experts’ median estimate, this may be seen as a signal of rising inflation, which could prompt the European Central Bank to raise short-term interest rates to ease inflationary pressure. Such a scenario may support demand for the euro but trigger declines in stock and bond prices.
On the other hand, if retail sales fall well below market expectations, this may be viewed as a signal of subdued inflation, which could even prompt the central bank to cut borrowing costs. Such a scenario may put the national currency under selling pressure.
Increasing retail sales in a sluggish economy, however, is another matter. This can be considered a sign that the economy is in the process of reviving. In such a context, rising retail sales would heighten the appeal of the national currency.
If retail sales growth is stagnating, this could mean that consumers are not spending at sufficiently high levels to support economic growth, which could increase the probability of a recession.
A crucial factor when examining retail sales is the extent to which the reported (actual) figure outperforms or underperforms experts’ median estimate. Beginner traders should note that a larger-than-projected increase in the retail sales figure usually supports demand for a given currency, while a smaller-than-projected increase usually triggers selling of that currency.
Example
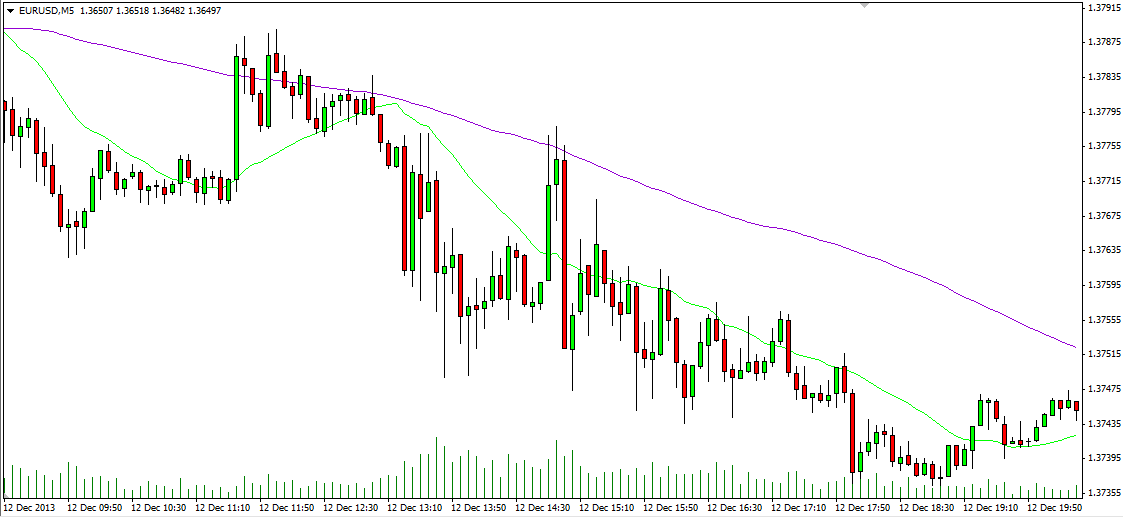
Source: MetaTrader 4 by MetaQuotes Software Corp.
The chart above illustrates how EUR/USD reacts to the release of the retail sales report from the United States at 13:30 GMT on 12 December. Overall sales climbed 0.7% in November compared with October, outpacing preliminary estimates of a 0.6% gain. The small green candle with a long lower shadow marks a move of about 20 pips in the EUR/USD pair, implying that the US dollar received some support after the upbeat result.
Personal Consumption Expenditures in general
 The Personal Consumption Expenditures Price Index, or PCE price index, is one of the most important government measures of consumer spending on goods and services in the United States. Personal consumption makes up about two-thirds of total household spending in the country while also accounting for more than 70% of economic output, as measured by the nation’s Gross Domestic Product. The PCE price index measures the average increase in prices of durable and non-durable goods and services purchased by individual consumers, families and the non-profit organisations that serve them.
The PCE index is based mainly on information from the GDP report, unlike the Consumer Price Index (CPI), which is based on household surveys conducted by the Bureau of Labor Statistics (BLS).
The Bureau of Economic Analysis (BEA) in the United States releases the PCE report each month, usually 30 days after the end of the reference month.
It is worth underscoring that in its “Monetary Policy Report to the Congress” dated 17 February 2000, the Federal Open Market Committee (FOMC) announced that it was changing its primary measure of inflation from the consumer price index to the “chain-type price index for personal consumption expenditures”.
Since it represents an index, the PCE indicator uses 2005 as its base year, when the base value was set to 100. The index reflects current personal consumption in today’s prices and then compares this with personal consumption at prices in the base year (2005). Therefore, the PCE index provides a clearer picture of overall inflationary trends in the economy.
How do traders read the Personal Consumption Expenditures Price Index?
If the PCE price index increases, this is considered an indication of potential inflation. If the PCE price index decreases, this would indicate potential deflation.
If the index shows a larger-than-expected increase during a given period (say, a month), this is a signal that the Federal Reserve’s inflation objective is being approached; consequently, demand for the national currency (US dollar) is likely to be boosted (traders would buy the greenback).
If the index shows a smaller-than-expected increase during a given period, this means that inflationary pressure remains subdued, and traders would sell the US dollar.
In addition, the PCE price index is used to determine how much households spend on consumption versus savings. Higher consumption levels suggest faster GDP growth, whereas a robust savings rate favours longer-term economic health, as savings can fund bank loans for mortgages and business investment.
The PCE price index is also used to understand trends in the sorts of goods and services bought by households. It provides information on how shopping patterns change in response to unexpected price increases, for example, rises in gasoline prices during the spring. The PCE price index can be a valuable tool for determining whether demand for various goods and services is elastic or inelastic. If demand is elastic, it will decrease as prices surge; if demand is inelastic, it will remain almost unchanged even as prices rise.
Core value
 Last but not least, the Bureau of Economic Analysis (BEA) also provides a core measure of inflation: the core PCE price index. This index excludes volatile components such as the prices of oil, gas and food. The core PCE price index tends to be less volatile than the core Consumer Price Index (CPI) because the two indicators are calculated differently. The formula used to calculate the CPI is likely to report wide price swings in gasoline and computer technology, for instance, while the formula used for the PCE price index is more likely to smooth out such swings.
All in all, the PCE price index serves as a reliable basis on which the Federal Reserve can adjust its benchmark interest rate to manage inflation.