Rectangle Price Pattern
This lesson will cover the following
- What is a rectangle?
- What types are there?
- How to trade these patterns?
An overview
 A rectangle usually forms when price action moves between two horizontal lines, the upper line acting as resistance while the lower acts as support. Each of these bounds must also be a trend line, or price action must touch both lines at least twice. This requirement is what separates rectangles from double tops and double bottoms, which require only three price reversals, as we have already noted.
Prices oscillate between the two parallel lines and eventually a breakout occurs in one direction or the other. Rectangles may have a slight tilt up or down, but the two lines (support and resistance) are always parallel. In this regard, they appear similar to horizontal channels. These formations reflect market participants’ indecision; therefore, the most important factor is the direction of the breakout once it occurs.
Within rectangles, prices may not always touch the two parallel lines but instead produce so-called “shortfalls”. At times, these shortfalls may hint at the probable direction of the eventual (real) breakout.

Here we can see a rectangle with an upward entry and a breakout to the upside.
Rectangle formations may often produce false breakouts, which offer no clue as to the direction of the eventual real breakout. Such moves usually do not constitute exits from the rectangle itself. They can be classified as minor breakouts that appear above or below the breakout levels, after which price returns inside the pattern. False breakouts are those that occur in the direction opposite to the actual breakout.
Another crucial factor in any pattern is volume. In the case of rectangles, however, whether volume increases or decreases within the formation has little or no effect on traders’ results after the breakout. Results do tend to improve if the breakout is accompanied by rising volume. Volume generally decreases as the rectangle develops.
Rectangles may lead to price reversals, but they can also act as trend-continuation patterns. In the first case, they occur more frequently at bottoms. In the second, they are known as bullish and bearish rectangles.
- Trade Forex
- Trade Crypto
- Trade Stocks
- Regulation: NFA
- Leverage: Day Margin
- Min Deposit: $100
What is a Bearish rectangle?
 A bearish rectangle forms when prices have been in a downtrend prior to the appearance of the pattern. Prices consolidate inside the rectangle for a period, after which the downtrend resumes. The consolidation likely occurs because some short-positioned traders lock in their gains, while other players wait for small pullbacks before entering the market. Intraday traders seek to exploit these moves and make short-term profits.
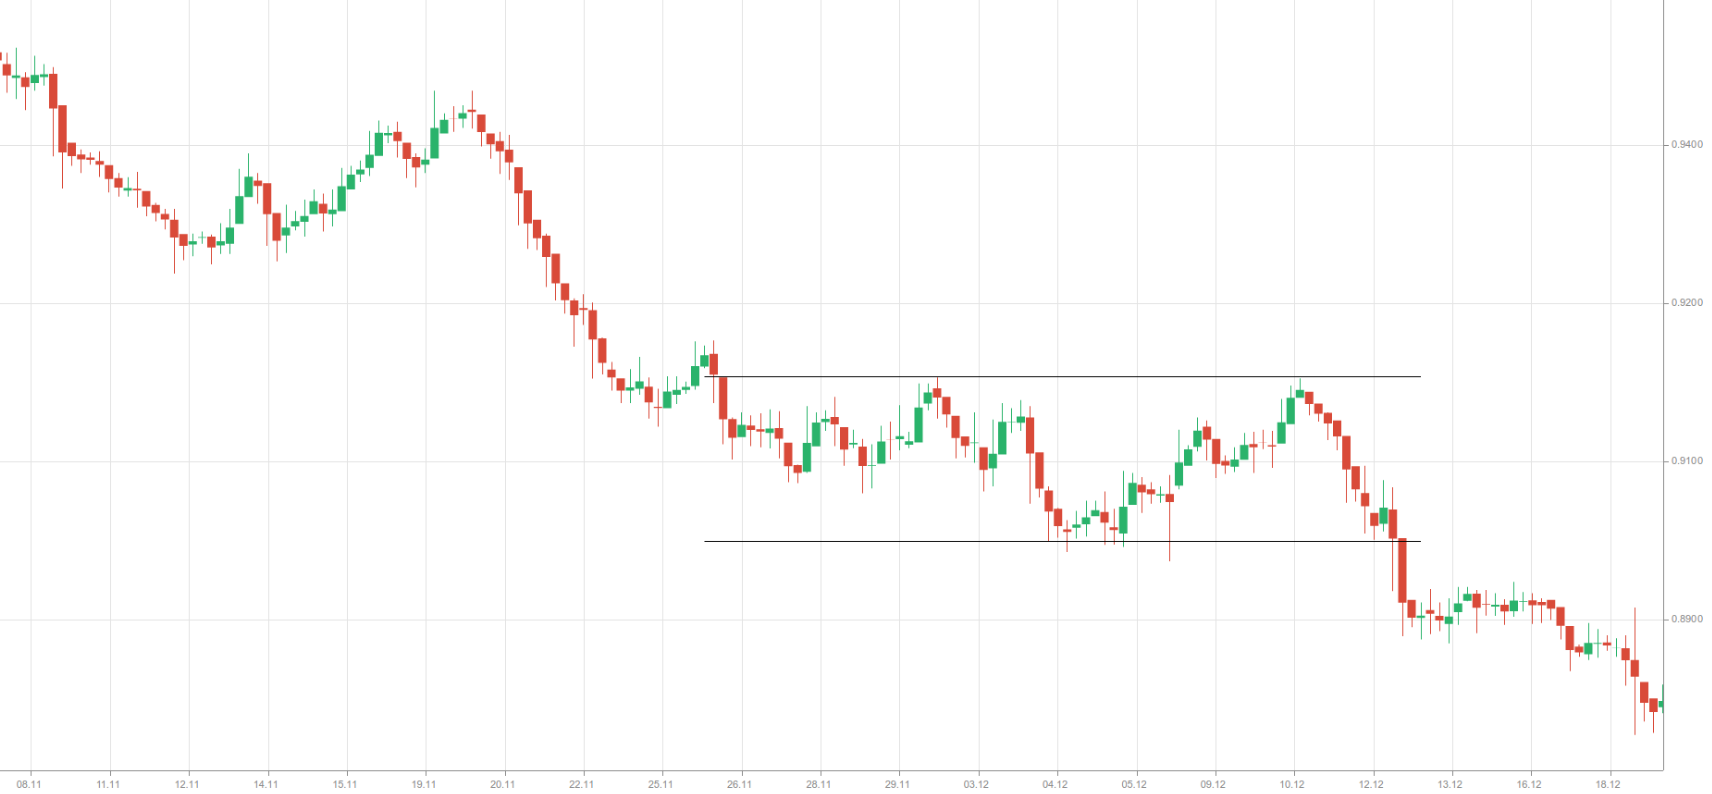
On the 4-hour chart of AUD/USD above we can see what a bearish rectangle looks like.
What is a Bullish rectangle?
 A bullish rectangle forms when prices have been in an uptrend prior to the appearance of the pattern. Prices again consolidate inside the rectangle for a period, after which the uptrend resumes. The consolidation likely occurs because some long-positioned traders lock in their gains, while others wait for minor throwbacks before entering the market.
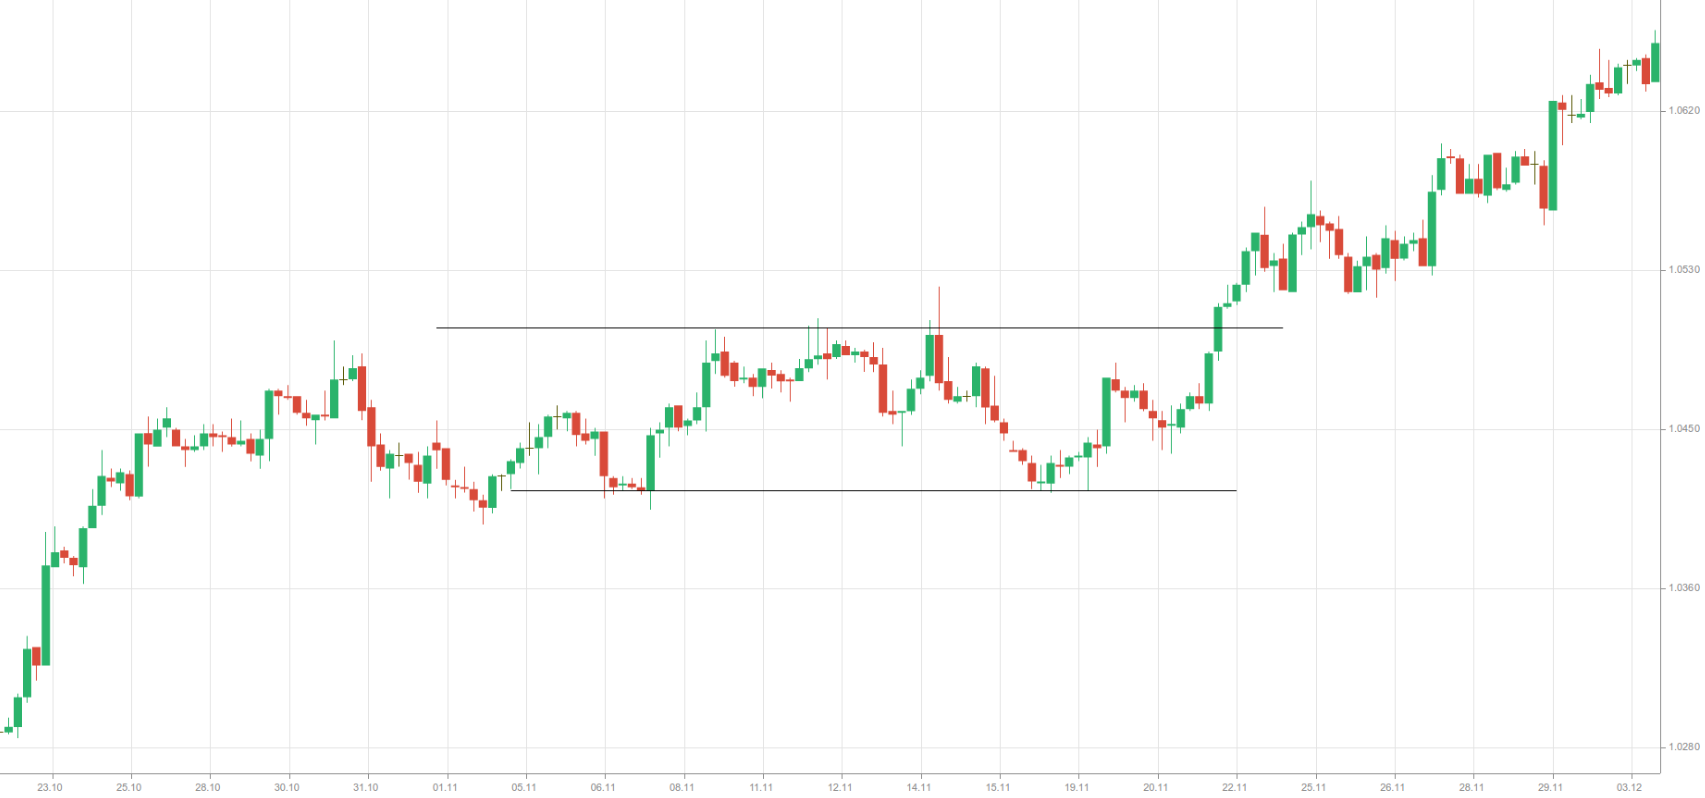
On the 4-hour chart of USD/CAD above we can see what a bullish rectangle looks like.
How to trade rectangles
 Several technical studies have concluded that rectangles more often appear as continuation formations. As two out of three rectangles tend to continue the trend, the expected breakout direction should initially be in line with the prior trend. Therefore, when trading rectangles it is usually safer to wait for the breakout to occur.
In this case, the profit target is usually estimated by measuring the height of the formation (the distance between support and resistance) and projecting it in the direction of the breakout.
For bearish rectangles, this height is projected just below the support level to obtain the profit target.
For bullish rectangles, the height is projected just above the resistance level to determine the profit target.
If an upward breakout occurs, stop-losses should be placed just below the upper bound (resistance). A more aggressive strategy is to place the stop-loss just below the lower bound (support), thereby giving the price more room.
If a downward breakout occurs, stop-losses should be placed just above the lower bound (support). A more aggressive trader may instead place the protective stop just above the upper bound (resistance).
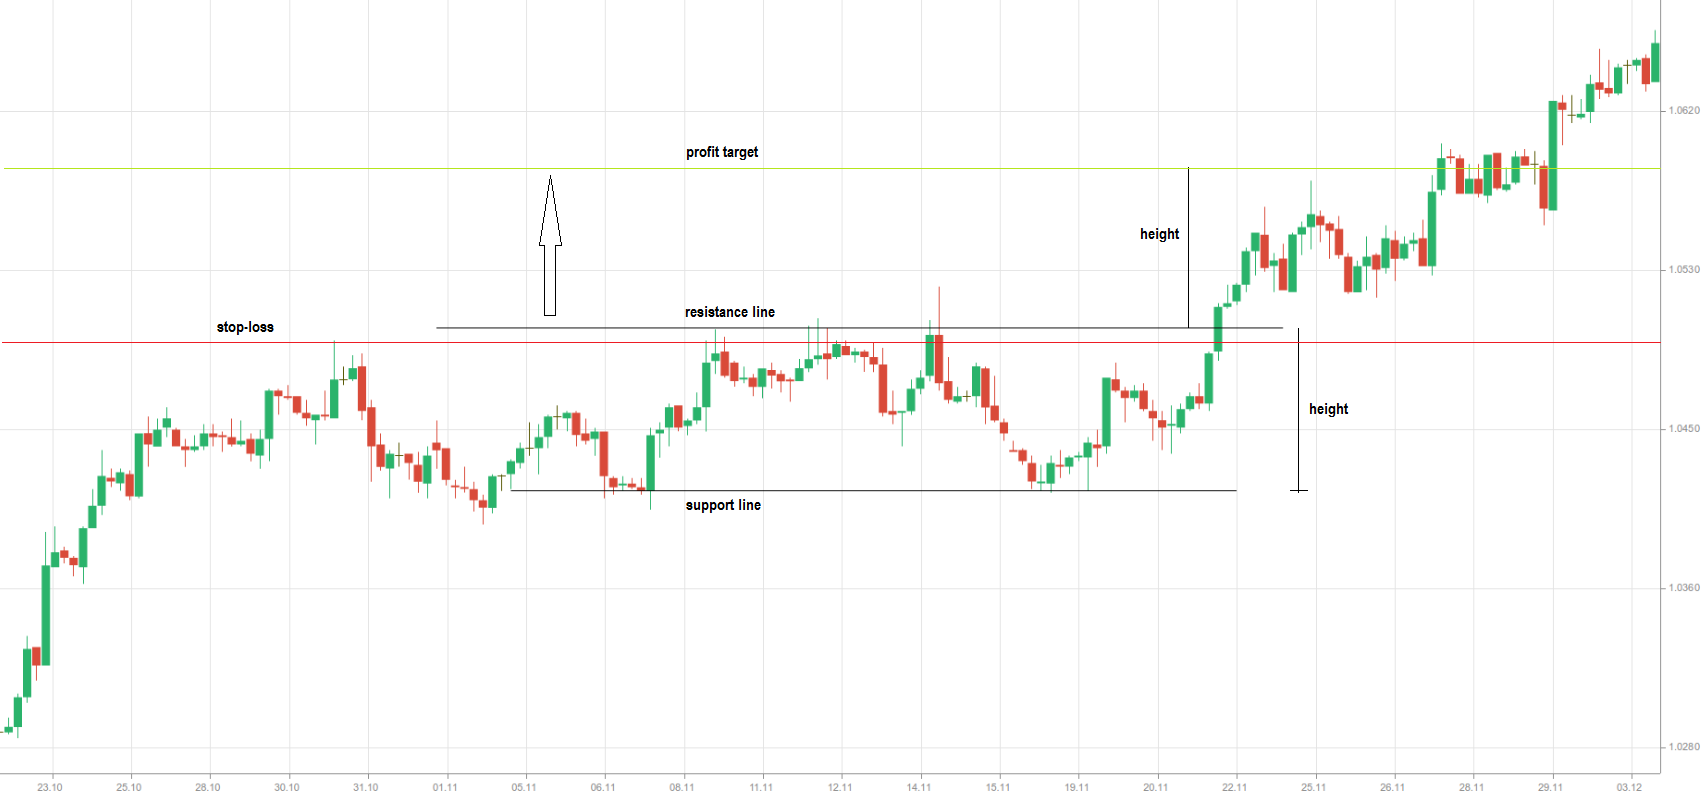
We have provided an example of how to trade a bullish rectangle. On the 4-hour chart of USD/CAD above we indicate the positions of the protective stop and the profit target while going long this currency pair. In this case, it is prudent to wait for the green candle that breaches the resistance level to close above it. The long entry should be taken when the next candle begins to form.
Some traders, on the other hand, prefer to trade within the rectangle itself. In this case they buy at support and sell at resistance. Such a strategy is not recommended unless the formation is sufficiently wide from top to bottom.
Another factor that must be considered before entering a trade is the inherent cost – commissions, slippage and the width of the spread for the particular instrument.
Also, when trading between two bounds, the lines are not always precise, and there is no guarantee that an order will be filled exactly at the bound.
Traders attempting this method need to place their sell orders a certain distance (filter) below the resistance zone and their buy orders a certain distance above the support zone.
Last but not least, the rectangle must be tall enough – support to resistance – to allow traders to absorb the costs and price filters mentioned above.
Price action must be monitored extremely closely in order to trade within the rectangle. Such a method is generally suitable only for scalpers, as it involves capturing a few pips between the two bounds (and the price filters) in the blink of an eye.