Rate of Change
This lesson will cover the following
- What is Rate of Change?
- How is the ROC calculated?
- How can it be used for trading?
Explanation and calculation
 The Rate of Change (ROC) is a momentum oscillator that measures how much the price of a tradable instrument has changed over a specified number of past periods. It compares the current price with the price “N” periods ago. As an oscillator, the ROC fluctuates above and below its zero value (zero line). It is usually calculated using the following formula:
ROC = {(P today – P n periods ago)/ P n periods ago} x 100
The ROC will be equal to zero if the current day’s price is the same as it was “n” periods ago. It shows how the current price relates to past price data on a continuous basis. Typically, prices rise as long as the Rate of Change remains positive, and fall while it remains negative. The oscillator can extend further into positive territory if the price advance accelerates. Conversely, it can sink deeper into negative territory if the decline gathers pace.
If the ROC is above its zero line but decreasing, this indicates that prices are still rising, albeit at a slower rate. If the ROC is below its zero line but rising, this suggests the market is not declining as quickly and the downtrend may be nearing exhaustion.
How can it be used in trading?
 As with any other oscillator, the Rate of Change can be used by traders in four major ways. First, the ROC’s position relative to the zero line can indicate the underlying trend. Second, it can act as a divergence indicator, showing when momentum is changing relative to the past. Third, the ROC can produce identifiable extremes that signal overbought or oversold conditions. Fourth, it can generate a signal when it crosses the zero line. However, in none of the above-mentioned cases is the signal reliable enough to be traded on its own; other technical tools should also be employed.
- Trade Forex
- Trade Crypto
- Trade Stocks
- Regulation: NFA
- Leverage: Day Margin
- Min Deposit: $100
Trend identification
 Although momentum oscillators are used most effectively during trading ranges or flat markets, they can also be employed to identify the overall direction of the prevailing trend. There are approximately 250 trading days in a year, 125 in half a year, 63 in a quarter and 21 in a month. As a rule, the long-term trend is considered an uptrend if both the 250-day and 125-day Rate of Change are in positive territory. This means that current prices are higher than they were 12 and six months ago. Conversely, the long-term trend is deemed a downtrend if both the 250-day and 125-day ROC are negative.
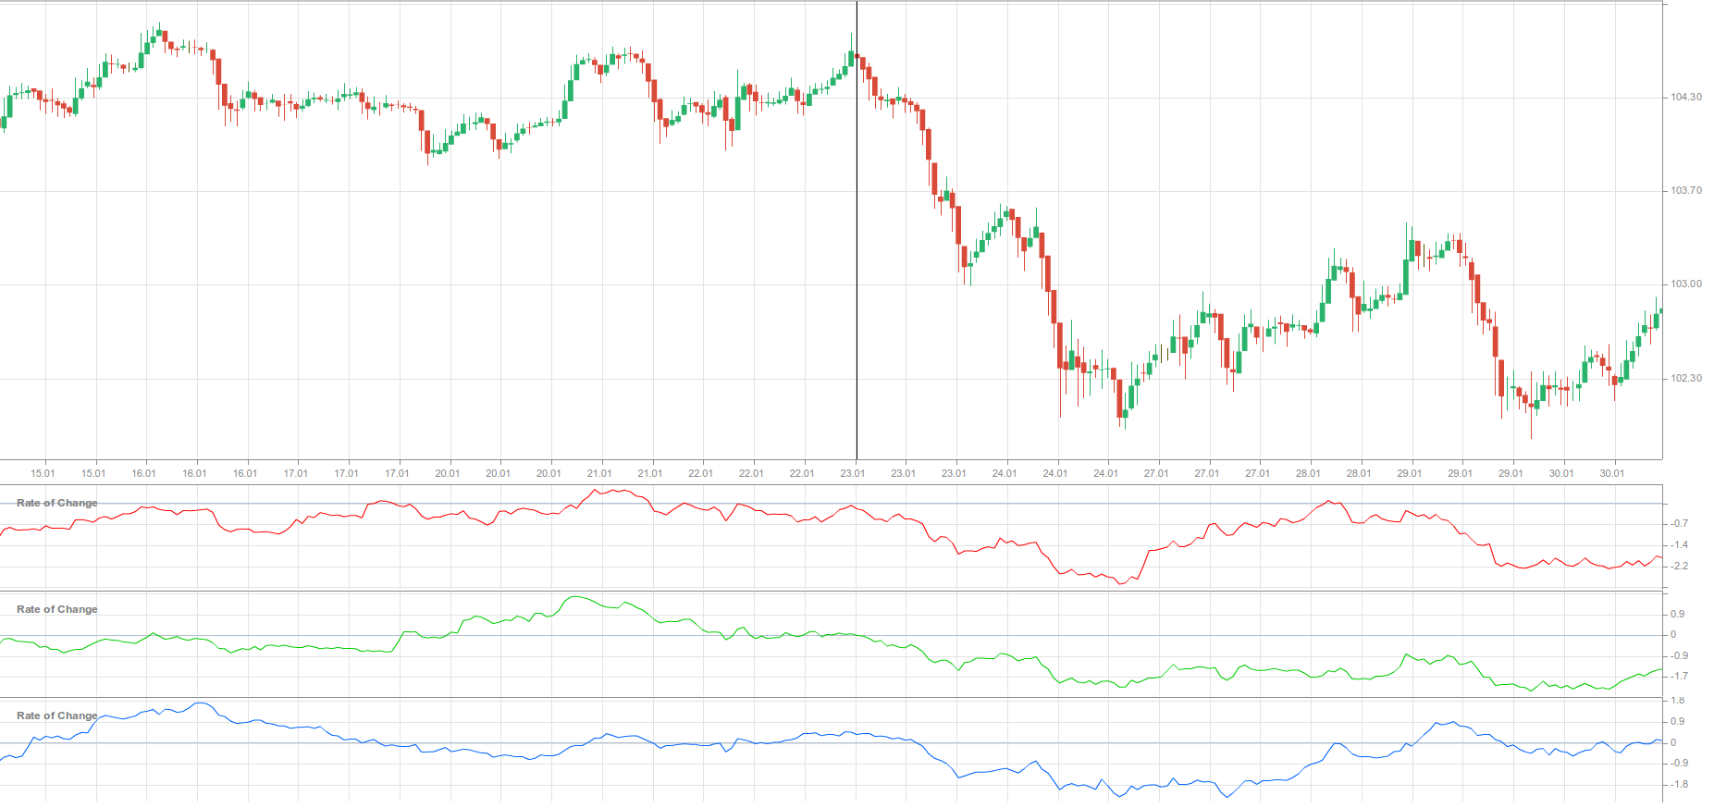
On this 1-hour chart of USD/JPY we can see that, since 23 January, the 250-period ROC (the red oscillating line) and the 125-period ROC (the green oscillating line) have moved below their zero line, indicating a strong downward price move. A few hours later the 63-period ROC (the blue oscillating line) did the same, which can be regarded as confirmation of the downtrend.
Overbought and oversold signals
 Some analysts believe that the 12-period and 25-period ROC are the most popular settings for short- or intermediate-term trading. The 12-period Rate of Change serves as a useful short- to medium-term overbought/oversold indicator.
The higher the ROC, the more overbought the instrument, and, consequently, the greater the chance of a decline. Conversely, the lower the ROC, the more oversold the instrument, and the greater the chance of a rally. However, novice traders should note that a market that appears overbought can remain so for some time; extreme overbought or oversold readings usually suggest that the current trend is likely to continue.
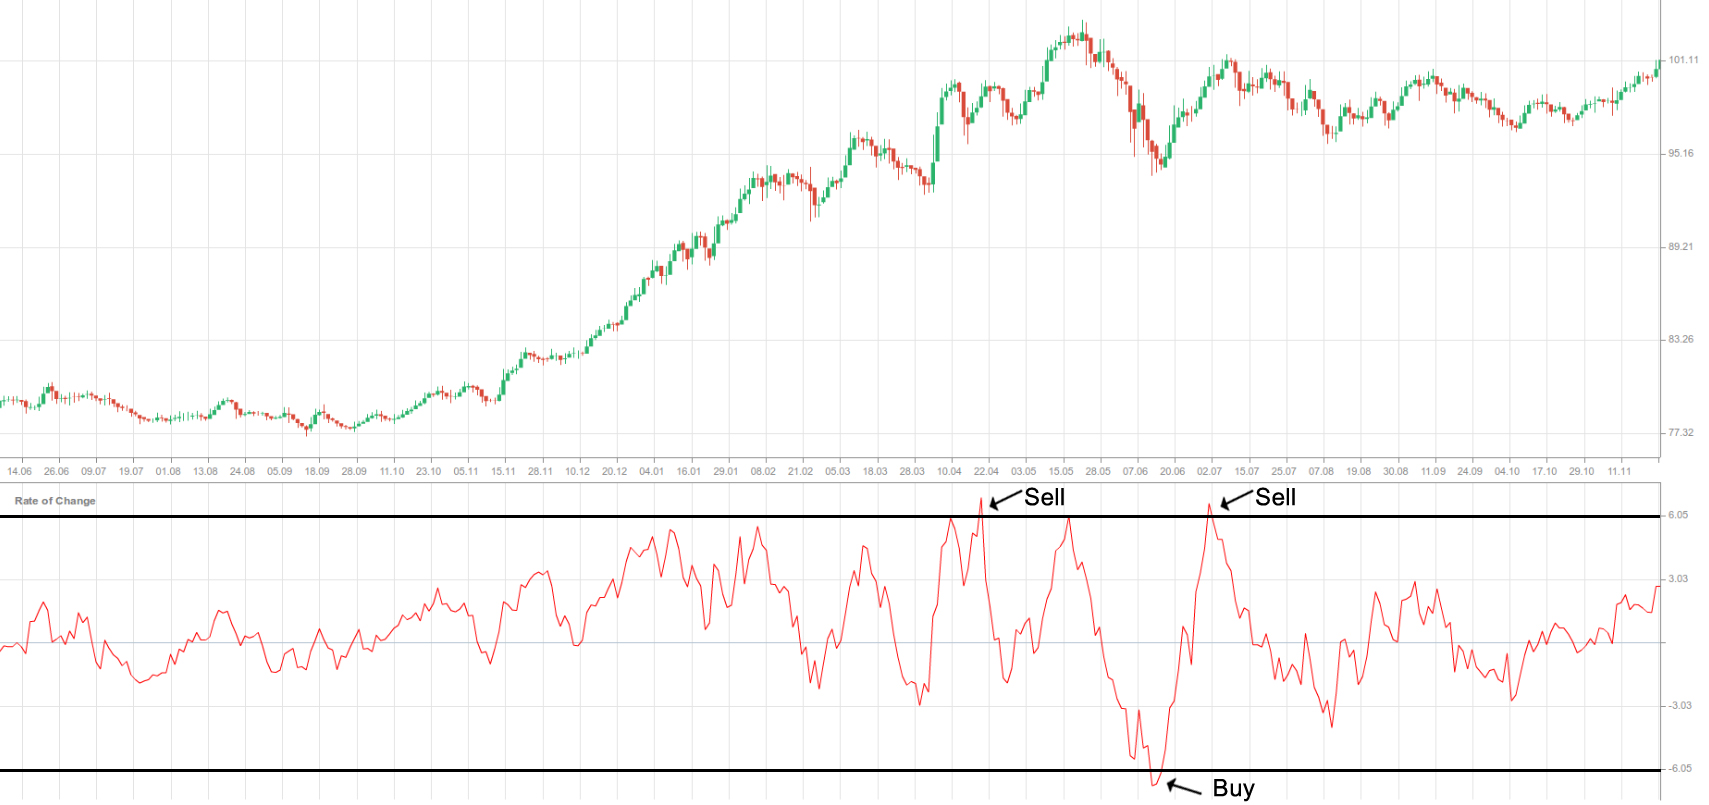
We placed “buy” signals each time the ROC fell below, and subsequently rose above, the oversold level of -6.0. Similarly, we placed “sell” signals each time the ROC rose above, and then fell below, the overbought level of +6.0. Determining these extreme levels requires experimentation and, as stated earlier, signals generated by the ROC are not 100% reliable.
Certain drawbacks
 The ROC does, however, have certain drawbacks. Although economists often calculate it using macro-economic data – usually on an annual basis to dampen seasonal effects – it suffers from the so-called “drop-off effect”. Only two prices, P today and P n periods ago, are used in the calculation, and they receive equal weighting. The older price, which occurred n periods ago, therefore has the same influence as the current (and arguably more relevant) price. As a result, the ROC can show a current increase or decrease based solely on which historic price drops out of the calculation. Some analysts smooth the Rate of Change with a moving average to minimise this effect.