Purchasing Managers’ Index (PMI)
This lesson will cover the following
- Description of the Purchasing Managers’ Index
- How traders interpret it
Purchasing Managers’ Index in general
 The Purchasing Managers’ Index (PMI) is a composite and timely indicator, providing clues regarding sentiment in sectors of the economy such as manufacturing, services and construction. This indicator is usually released on the first business day of each month following the survey month by the Institute for Supply Management (ISM), a non-profit organisation with more than 40,000 members engaged in supply management and purchasing professions.
The PMI is a composite index comprising five “sub-indexes”, which usually correspond to surveys encompassing more than 400 purchasing managers operating within the country and selected for their geographic and industry diversity. These five sub-indicators are given a weighting, as follows:
– Production level 0.25
– New orders from customers 0.30
– Supplier delivery times 0.15
– Inventories 0.10
– Employment level 0.20
As the index is based on a survey, its results are usually reduced to only three options. Managers participating in the survey can respond with “better”, “same” or “worse” to questions about the industry in which they operate. The value of the index is calculated as follows:
PMI = (P1*1) + (P2*0.5) + (P3*0), where
P1 is the percentage of responses that reported an improvement,
P2 is the percentage of responses that reported no change in conditions,
P3 is the percentage of responses that reported worse conditions.
The resulting PMI value is measured from 0 to 100. If the index shows a value of 100.0, this means that 100% of the respondents reported an improvement in conditions. If the index shows a value of 0, this means that 100% of the respondents reported a deterioration in conditions. If 100% of the respondents saw no change in conditions, the index will show a reading of 50.0.
The Institute for Supply Management publishes this indicator for the United States. Similar indicators for countries in the Eurozone and the United Kingdom, for example, are released by the Markit Economics research group.
- Trade Forex
- Trade Crypto
- Trade Stocks
- Regulation: NFA
- Leverage: Day Margin
- Min Deposit: $100
How do traders read the Purchasing Managers’ Index?
 When a fundamental analyst examines a PMI, the key level he or she considers is 50.0. A reading of 50.0 or higher indicates that the industry (sector) is expanding. If the manufacturing sector is expanding, overall economic activity should be increasing as well. Therefore, the PMI is also regarded as an indicator that provides clues about a nation’s future GDP levels. Many economists adjust their GDP forecasts after reading the PMI report.
Another reading of utmost importance is 42.0. If a PMI shows a reading higher than 42.0 over time, this is usually indicative of economic expansion (a growing GDP). The different values between 42.0 and 50.0 suggest how strong this expansion is. If the PMI reading falls below 42.0, it may indicate that a recession (economic contraction) is on the horizon.
The month-to-month rate of change is crucial. This is the factor that influences a country’s currency when manufacturing or services PMI data are published.
If a report states that a nation’s manufacturing PMI is, say, 50.5 this month (indicating expansion in the manufacturing sector), after having reached, say, 55.6 the previous month, such a performance would probably not be viewed favourably by market participants, especially if that economy had recently shown signs of resilient growth. Thus, traders would be inclined to sell (short) the currency of that nation. If we are referring to the German manufacturing PMI, traders would sell the EUR/USD pair (selling the euro and buying the US dollar, as discussed earlier).
Example
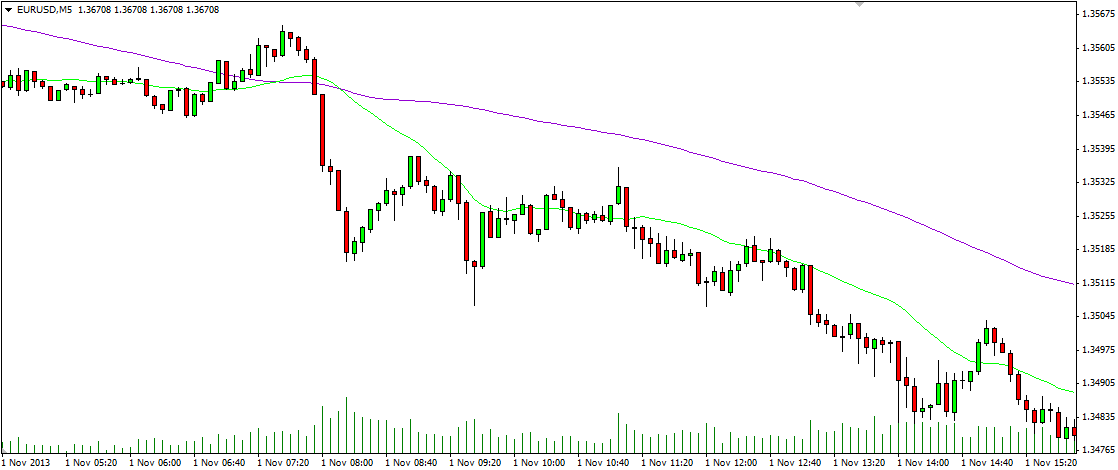
Source: MetaTrader 4 by MetaQuotes Software Corp.
On the chart above we can see how EUR/USD reacted to the announcement of the US manufacturing PMI at 14:00 GMT on 1 November. The ISM report showed that the index rose to 56.4 in October, surpassing expectations of 55.1. The three red candles starting at 14:00 GMT illustrate a movement of about 15-20 pips in the EUR/USD cross (traders obviously supported the greenback after the upbeat result).