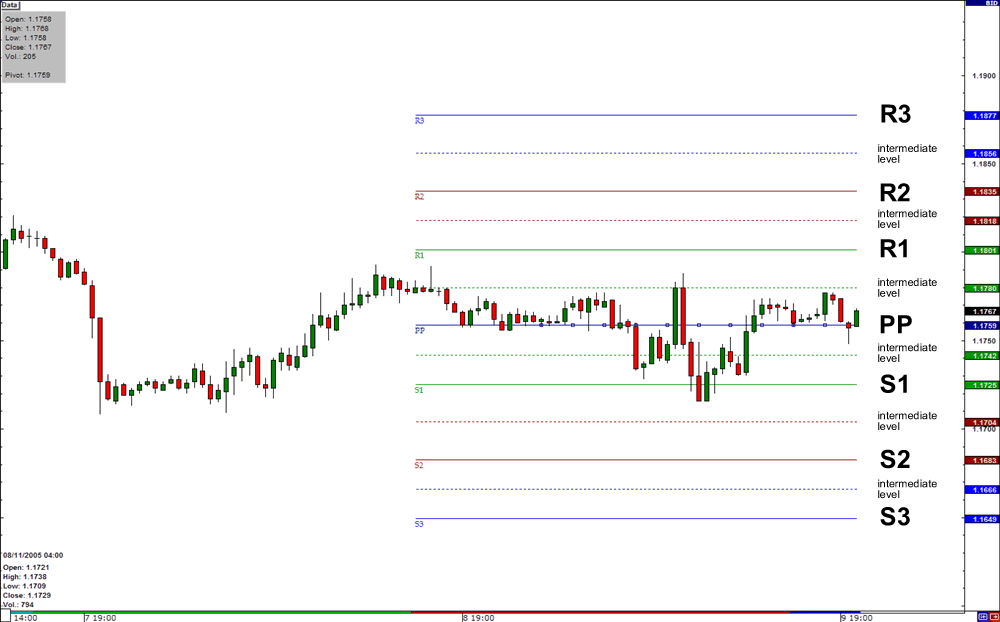
Pivot Points
This lesson will cover the following
- What is the Pivot Point technique
- How to calculate Pivot Points
- What is the purpose of Pivot Points
The Pivot Point technique is a method of determining the most likely support and resistance levels. It is commonly used by day traders to identify potential price ranges for the day. The technique is also used to confirm breakouts.
The pivot point represents the level at which market direction may change during the day. Using simple calculations and the previous day’s high, low and close prices, several points can be derived. These points may prove to be crucial support and resistance levels. They are known as pivot levels.
During each trading day, the market in which a trader is interested records an open, a high, a low and a close price. This information provides all the data needed to calculate the pivot points.
The main reason pivot-point trading has gained such popularity is that pivot points have a predictive nature and are also easily calculated. Traders use the previous day’s data to calculate potential turning points for the current day, the day they intend to trade.
How to calculate Pivot Points
 As a large number of traders rely on pivot points, it is evident that the market reacts to these levels. This usually provides a good opportunity to enter trades. If a trader prefers to calculate the pivot points manually, the formula is as follows:
Pivot Point = ( High + Close + Low )/3
Resistance 3 = High + 2*(Pivot – Low)
Resistance 2 = Pivot + (R1 – S1)
Resistance 1 = 2 * Pivot – Low
Support 1 = 2 * Pivot – High
Support 2 = Pivot – (R1 – S1)
Support 3 = Low – 2*(High – Pivot)
- Trade Forex
- Trade Crypto
- Trade Stocks
- Regulation: NFA
- Leverage: Day Margin
- Min Deposit: $100
Explanation
As shown in the formula above, by using the previous day’s high, low and close prices, a trader ends up with seven points: three resistance levels, three support levels and the actual pivot point.
If the market opens above the pivot point, the current day’s bias is more likely to be bullish, as long as the price remains above the pivot point. Conversely, if the market opens below the pivot point, the bias is more likely to be bearish, provided the price remains below it.
 The idea behind trading pivot points is to anticipate a reversal or a break at R1 or S1. By the time price action reaches R2 or R3, or S2 or S3, the instrument is likely to be overbought or oversold, so these levels are better used for exiting the market rather than entering.
A perfect scenario would be for the market to open above the actual pivot point, stall slightly at R1 and then continue to R2. A trader might choose to enter on a break of R1, set R2 as the target and, if the market shows strength, close half of the position at R2. The next target for the remaining portion of the position would then be R3.
The major advantage of the pivot point technique is that many traders use the same levels, derived from the same formula. There is no discretion involved. In contrast, the method of drawing support and resistance levels and trend lines can be more subjective.
A distinctive feature of pivot lines is that they can become a battleground for past and future price action. Once a trader plots the appropriate pivot lines on the chart, all the “historic battle sites” of the market become visible. Specifically, it becomes clear which pivot levels have been bounced or broken and which support and resistance levels have held or been overtaken. Thus, a trader can predict where “future battles” in the market are likely to take place.
We can say that pivot lines grant any trader access to the “General’s tent”, where the armies of the bulls and the bears are positioned on the map. Armed with this knowledge, a trader can construct his or her own strategy.