Moving average convergence divergence (MACD)
This lesson will cover the following
- What defines the MACD?
- How to read the MACD histogram?
- What is a divergence fake-out?
- Learn how to use the MACD histogram for both entries and exits
Moving Average Convergence Divergence (MACD) is one of the most popular technical indicators in trading. The MACD is favoured by traders worldwide because it is straightforward to understand and highly flexible. It is commonly used both as a trend-following indicator and as a gauge of momentum.
It helps traders decide which direction the price may take, how strong that movement could be, and when a trend is likely to reverse. The MACD enables a trader to catch a trend as soon as it begins and to exit just before it comes to a halt.
- Trade Forex
- Trade Crypto
- Trade Stocks
- Regulation: NFA
- Leverage: Day Margin
- Min Deposit: $100
What defines the MACD?

The idea behind the Moving Average Convergence Divergence is straightforward. This indicator shows the difference between the 12-day and 26-day exponential moving averages (EMA) of a tradable instrument. If we compare these two moving averages, the 12-day EMA is the faster one, while the 26-day EMA is slower. Both are calculated using the closing prices of the respective periods. On the chart, an additional 9-day EMA is usually plotted; it serves as a signal line for long or short entries. The MACD normally generates a buy signal when it rises above its 9-day EMA and a sell signal when it falls below that line.
Calculating the MACD is actually quite simple once one knows how to calculate moving averages. For any currency pair or other instrument:
First, calculate a 12-day EMA using closing prices,
Second, calculate a 26-day EMA using closing prices,
Third, subtract the longer-term EMA from the shorter-term EMA,
Fourth, calculate a 9-day EMA of the MACD line produced by the subtraction above.
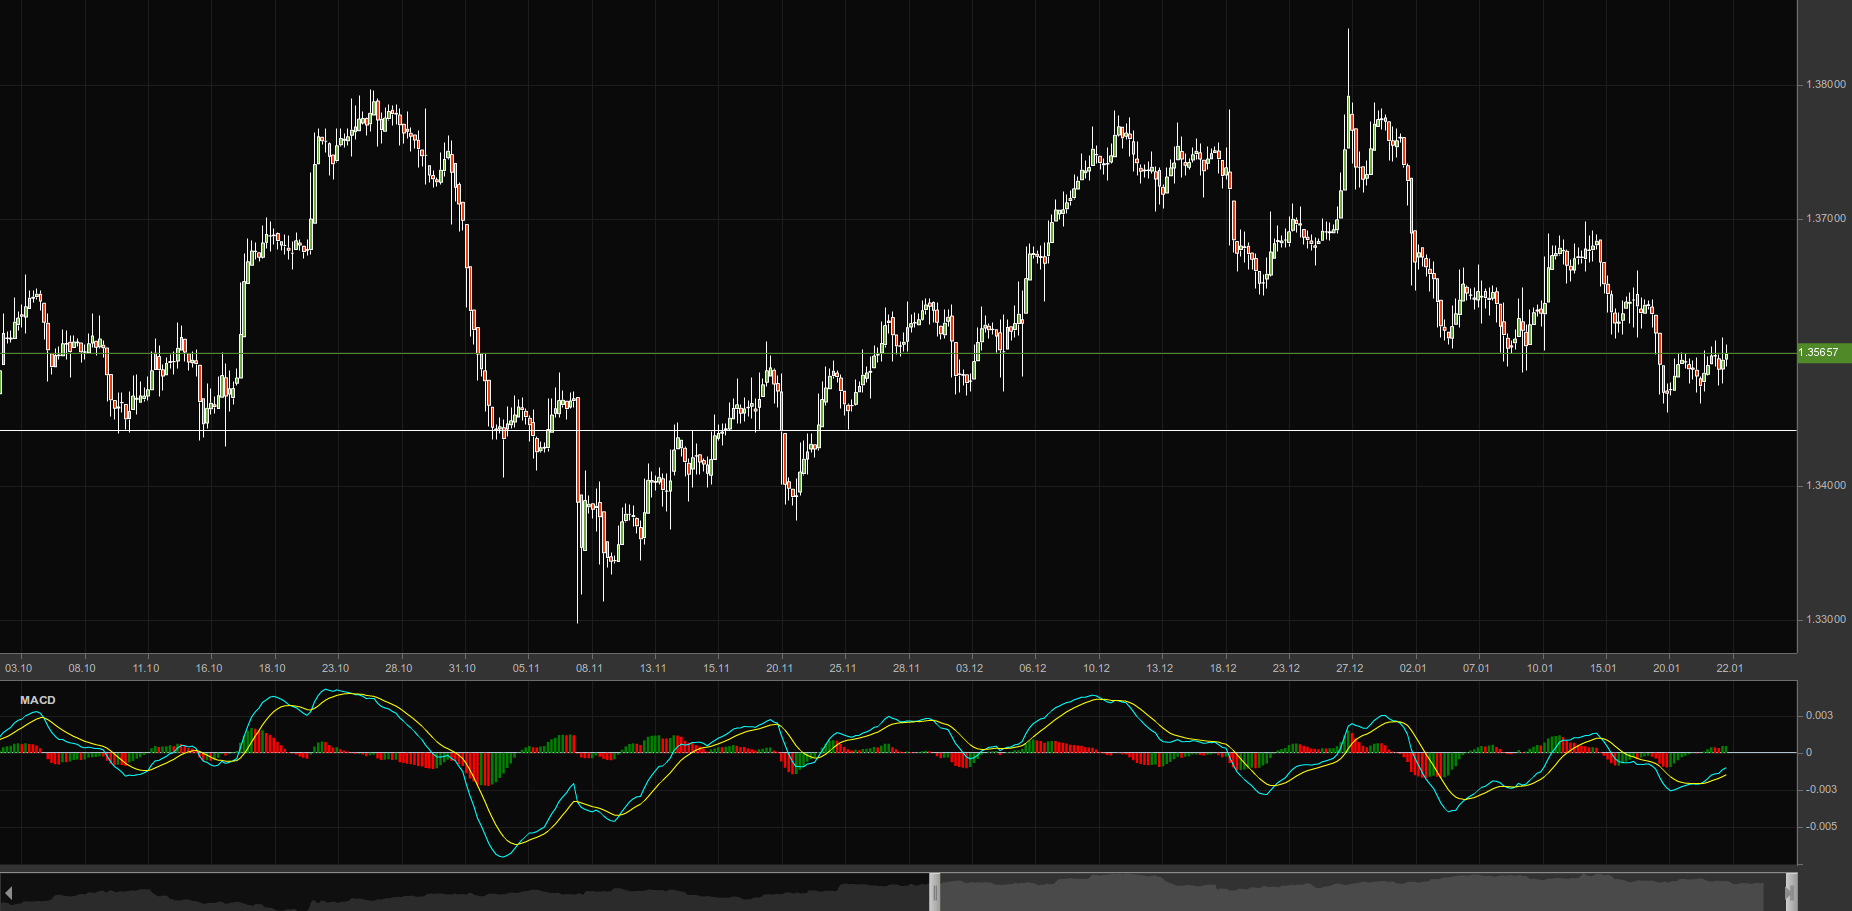
The chart above shows an example of the MACD indicator applied to a currency pair.
MACD histogram

The MACD histogram provides an excellent visualisation of the difference between the MACD and its 9-day EMA. The histogram tends to be positive if the MACD is above its 9-day EMA, and negative when the MACD is below it.
When prices rise, the histogram will expand because the pace of price action accelerates. If the pace decelerates, the histogram will contract.
The same principle works in reverse during falling prices.
The histogram is what attracts many traders to the MACD, especially those who aim to gauge momentum. It responds to the speed at which prices move. Consequently, many traders use the MACD more often to measure the strength of price movement than to determine trend direction.
Divergences can also be spotted with the MACD histogram. A common setup is to find points where price action makes a new swing high (or low) but the histogram fails to follow suit, signalling a divergence between price and momentum.
Divergence fake-out
 Trading divergences, however, does not offer high accuracy. In most cases the setup fails rather than succeeds. Prices often stage a final surge or plunge, triggering protective stops and forcing players out of the market before the move reverses and the trade turns profitable.
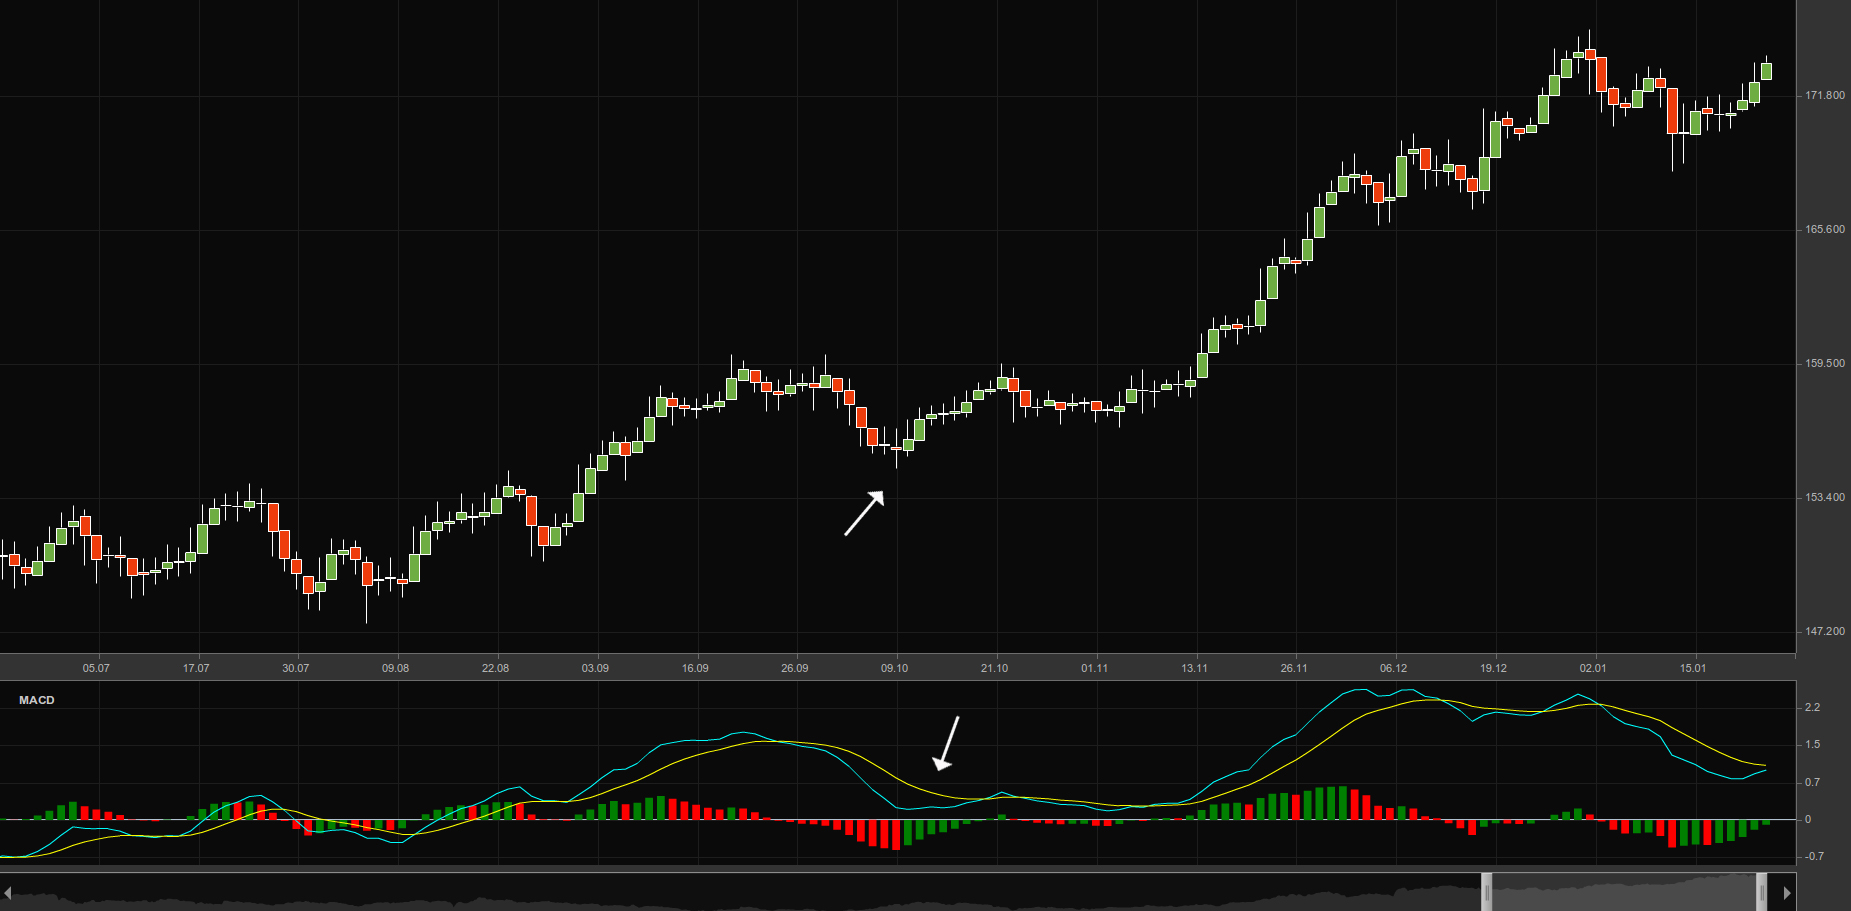
The chart above illustrates a divergence fake-out, a situation that has troubled many traders in the past.
Traders often record losses with this strategy because they enter when the MACD gives a signal but decide to close the position solely on price movement. As the MACD histogram is derived from prices yet is not the price itself, this approach is the trading equivalent of ‘mixing apples and oranges’.
How to use the MACD histogram to enter and exit the market
 To resolve the dilemma between entry and exit, one may use the MACD histogram for both signals.
When trading a negative divergence, traders might partially sell at the point where the divergence first appears. Instead of placing the protective stop at the nearest swing high based on price alone, they exit the trade only if the high of the MACD histogram rises above its previous swing high. Such a move implies that momentum is, in fact, accelerating and that the position is incorrect.
If the MACD histogram does not print a new swing high, traders add to their initial position, seeking a better average price for their short entry.
Forex traders can implement such a strategy with ease. The larger the position, the greater the potential profit once the price changes direction. In currency trading this approach can be used irrespective of position size, as traders need not worry about influencing prices. They can transact 100,000 currency units or just 1,000 currency units while still enjoying spreads of 3-5 points in the major pairs.

This approach forces traders to average up because the market moves against them for a time. Nevertheless, it is not regarded as a reliable strategy. A number of books have labelled such a method ‘adding to your losers’.
Taking the histogram into account, trading the MACD instead of the price itself presents a fresh way to exploit a familiar idea – the divergence. Using this method in Forex trading, which allows scaling in and out of positions with minimal effort, makes the concept particularly attractive to day traders and position traders.