Market Facilitation Index
This lesson will cover the following
- What the Market Facilitation Index is
- How it is calculated and visualised
- What it shows us and how to use it
The Market Facilitation Index (MFI), created by Dr Bill Williams, is a volatility indicator that aims to measure how willing the market is to move the price. The indicator’s absolute values alone are of no use to traders, as they provide no trading signals. Instead, it derives its significance from being used to analyse price-movement efficiency by combining price and volume.
By computing price movement per unit of volume, the BW MFI can help you decide when a trend is strong enough to trade safely, when a new trend is forming, or when to avoid entering the market altogether. It allows you to determine whether the market is liquid and whether the different types of market players are active. If market activity drops, users of the MFI can see that both volume and price-movement efficiency are decreasing.
- Trade Forex
- Trade Crypto
- Trade Stocks
- Regulation: NFA
- Leverage: Day Margin
- Min Deposit: $100
Calculation
 The Market Facilitation Index is based on a very simple calculation and is considered by some experts to be a better measure of market action than the Relative Strength Index and the Stochastic Oscillator. It is estimated using the following formula:
MFI = (High – Low) / Volume
Where:
High = the highest price of the current bar
Low = the lowest price of the current bar
Volume = the volume of the current bar
Results
The results of the calculation are visualised through a histogram comprising bars in four different colours, as illustrated in the screenshot below.
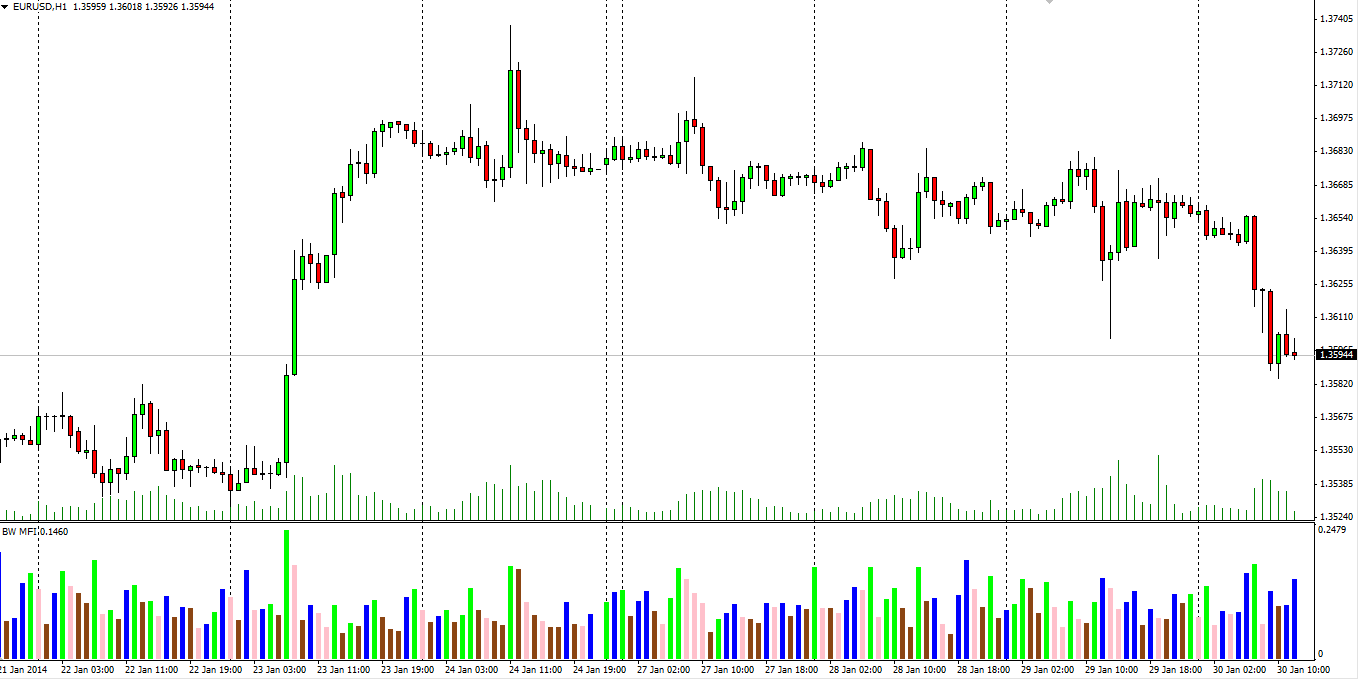
The index’s absolute values are represented by the bars, while the comparison between changes in the index and in volume is shown by four different colours, which are key to reading the signals the MFI generates.
In the screenshot below you can see the MetaTrader 4 menu with the four differently coloured bars.
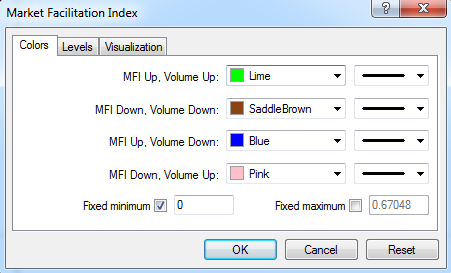
Here is what they represent:
 The histogram’s green bar indicates that both the MFI and volume are rising. This suggests that the market is already on the move and traders should enter a position in the same direction as the prevailing trend, while opposite trades should be closed. A green period occurs when an increasing number of traders enter the market and sentiment supports the current price movement, thus pushing it further in that direction.
 This condition is visualised by a brown bar. It reflects the end of a trend, when both the MFI and volume are declining as the market loses interest in the current price movement and looks for signs of future direction. Investors are currently indifferent, but this bar is a precursor to a big move. Williams suggests that market players should watch closely for any signs of building momentum, which in this case can be signalled early by the formation of several consecutive brown bars.
 This situation is illustrated by a blue bar. It represents a period during which the MFI is rising while volume is falling. It suggests that the market is making a progressive move, but one that is not supported by volume. Because traders show little interest, they are not supporting the current price movement by opening new positions. This indicates that the price is moving as a result of an attempt by a certain group of brokers and dealers to control and manipulate the market to their advantage. Such a condition often ends with a price reversal.
 Signified by a pink bar, this reflects a situation in which the MFI falls but volume increases. During this period, a battle takes place between bulls and bears that will determine who will be in control during the next trend. As more and more traders enter the market, volume increases, but because the two sides are relatively evenly matched, the price does not change significantly. Eventually, one of the contending sides will overcome the other. Since this situation usually occurs prior to a significant move, you should pay close attention to the direction the price takes after breaking out of this slowdown.
According to Bill Williams, this is the strongest money-maker of the four combinations, as a breakout can occur that leads either to the continuation of the current trend or the formation of a new one. Therefore, anyone who makes the right decision can benefit from a longer price movement and achieve better results.