Introduction to Moving Averages
This lesson will cover the following
- What is a moving average?
- How to follow trends using it?
- Types of moving averages
- Moving averages as support and resistance
Moving averages are among the most popular and widely used indicators. They represent a method of smoothing price data and removing noise to reveal and measure a trend. Moving averages are the foundation of many technical trend-following systems. As trend-following, lagging indicators that always trail price action, they are used to confirm trends once those trends have already begun. Comparison between moving averages of different time periods can also indicate market momentum.
Example
 A moving average represents the average value of a given data set. For instance, a moving average could be calculated using the closing price over, say, the previous 20 trading days. In this example, the moving average adds the closing prices over the previous 20 trading days and divides the total by 20 to produce an average value.
- Trade Forex
- Trade Crypto
- Trade Stocks
- Regulation: NFA
- Leverage: Day Margin
- Min Deposit: $100
Trend-Following Tool
 Moving averages are usually used as trend-following tools. Because they are lagging indicators, they reveal that a trend has started only after it has already occurred. The closing price is considered the most important price level of the trading day and is the figure most commonly used in calculating a moving average. The midpoint price can also be used. Some technical analysts use an average of the high, low and closing prices. Price bands can also be created by averaging the high and low prices separately.
Consider a 20-period moving average on a 10-minute chart. Each point of the moving average is calculated from the average closing price of the last twenty 10-minute candles. With each new 10-minute candle, the moving average continues to use the average closing price of the most recent twenty periods. This results in a continuous line.
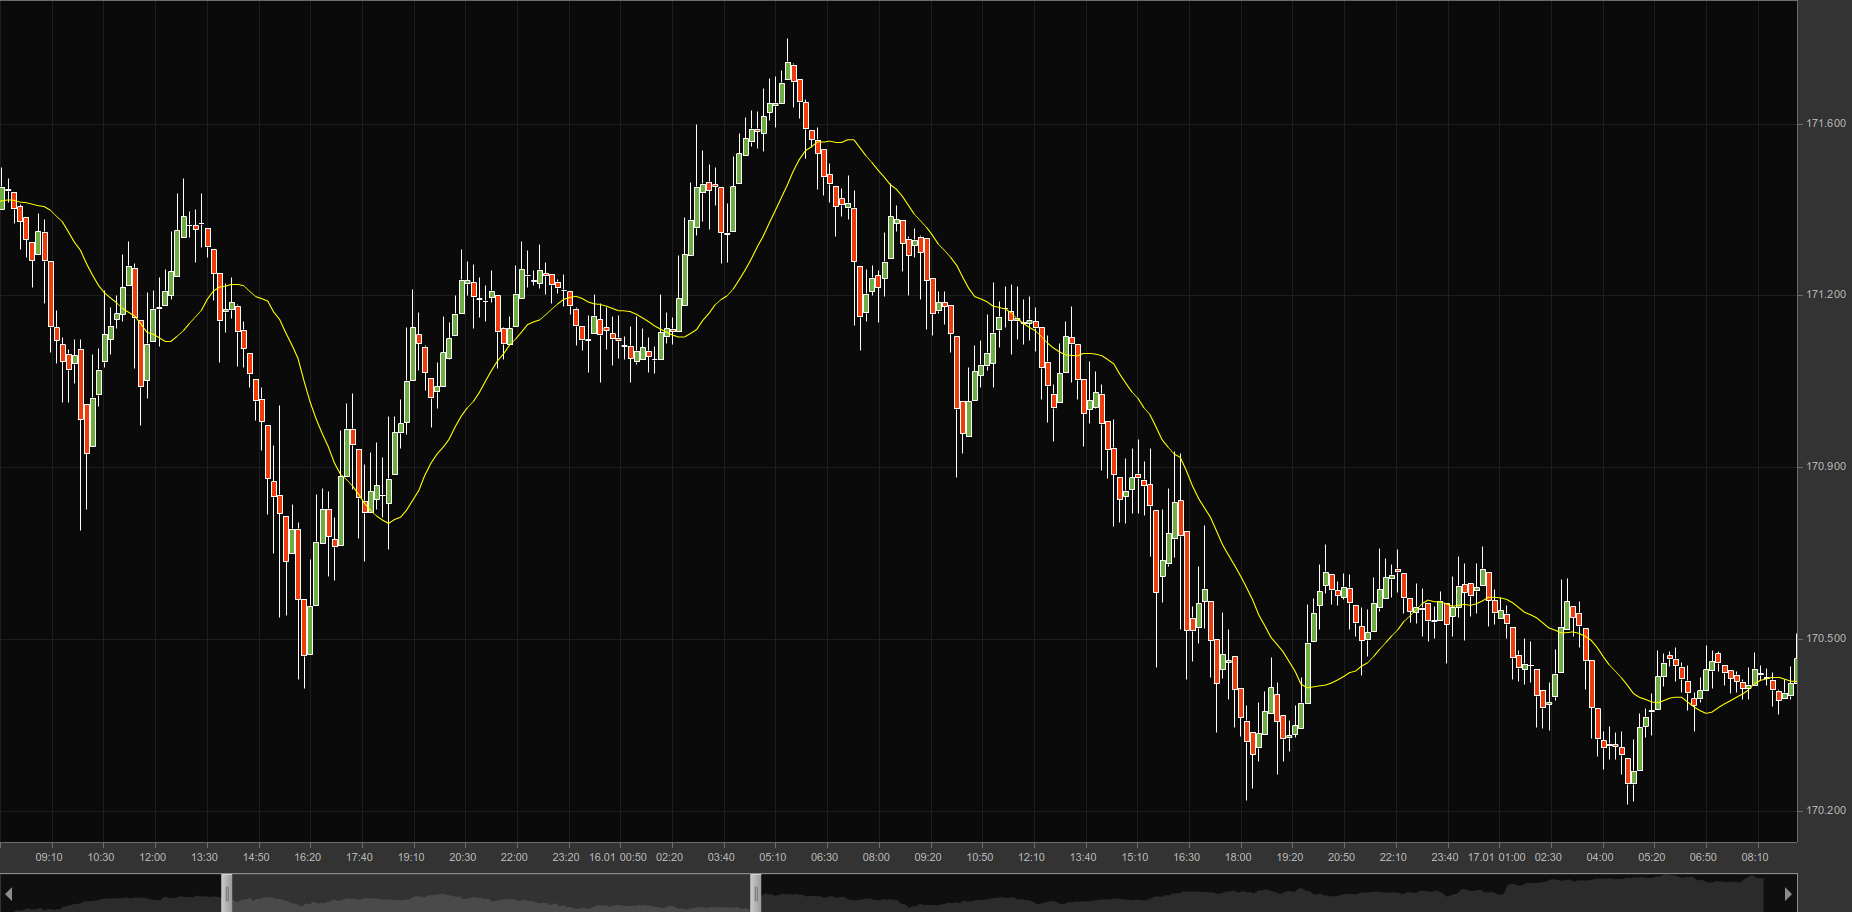 A moving average need not be 20 periods; the period can be adjusted so that a trader may use whichever length they prefer.
Moving averages come in various forms, but their underlying purpose remains the same: to help technical traders track the trends of financial assets by smoothing out day-to-day price fluctuations, or noise. By identifying trends, moving averages enable traders to make those trends work in their favour and, ideally, increase their number of winning trades.
Different types of moving averages
 Four types of moving averages can be recognised: Simple, Exponential, Linear-Weighted and Smoothed-Weighted.
The fundamental difference between these types of moving averages lies in the way they are calculated. Because of this, they appear differently on the price chart. The simple moving average uses each period with equal weighting. The exponential, linear-weighted and smoothed-weighted averages place greater emphasis on the most recent periods.
A linearly weighted moving average places more weight on recent price data than the standard simple moving average. However, its popularity has been eclipsed by that of the exponential moving average. The same is true of the smoothed-weighted average, which is rarely used in trading. For this reason, in our next articles we shall focus on the first two types – the simple and the exponential.
How to choose the period of Moving Averages
 There are no strict rules for selecting the number of periods for a moving average. In most cases, the choice is entirely discretionary. Depending on the period chosen, moving averages are often classified as short-term (10-30 periods), medium-term (30-80 periods) and long-term (100-200 periods).
The shorter the period of a moving average, the more rapidly it will respond to price action. However, it is also more likely to generate less reliable signals than a longer-term moving average.
The longer the period of a moving average, the more slowly it will change with price action. However, the signals it provides are generally more reliable.
A 5-period moving average considers only the last five periods and therefore reacts very quickly to changes in price direction. The main drawback is that it tends to generate false trend-change signals when short-term price spikes occur.
By contrast, a 200-period moving average reacts much more slowly, but usually produces far fewer false signals. The downside is that signals occur less frequently because of the slower response.
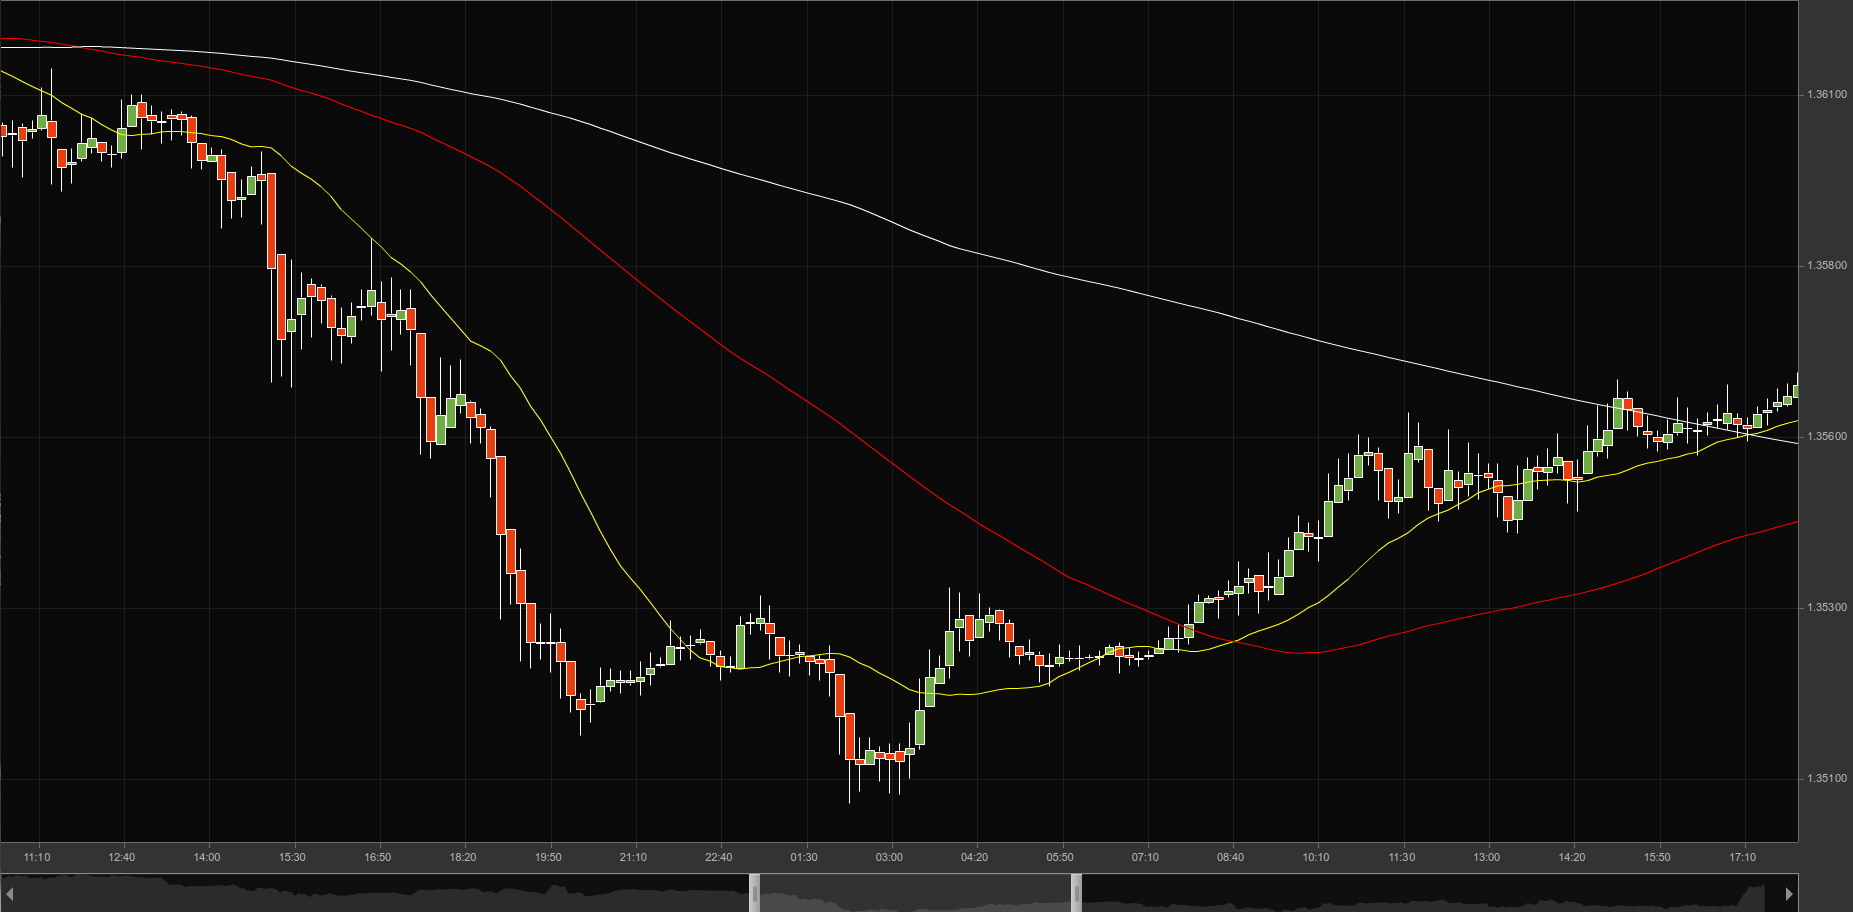
In the chart below you can see how the 20-period moving average (yellow line) changes direction much more rapidly in response to price action, while the 200-period moving average (white line) barely changes. The 80-day moving average (red line) sits between the two.
Using moving averages as support and resistance
 Moving averages can act as support or resistance when a trader is seeking an entry or exit point in the market. Put another way, when price touches the moving average on the price chart, the trader may enter either a long or a short position. Essentially, this works in the same way as horizontal support and resistance lines.
Moving averages are known as dynamic support and resistance because they move with price.
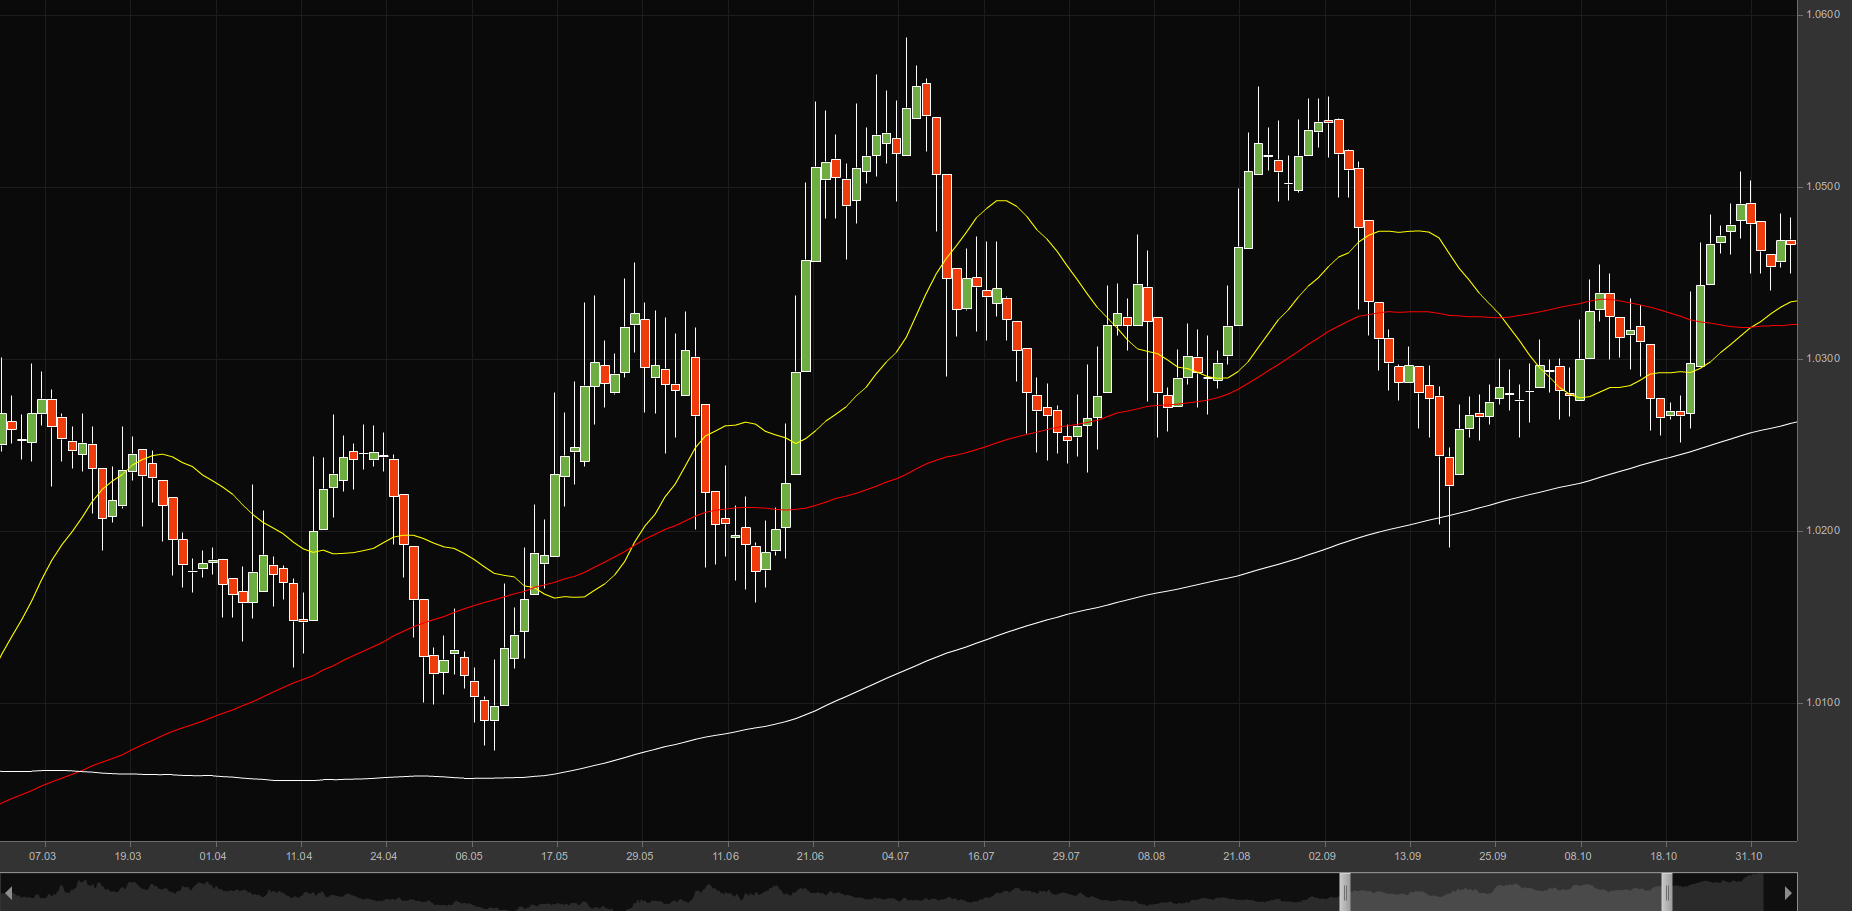
If current price action is above the moving average, the latter will act as support. As you can see from the graph, the white line – the 200-day simple moving average – is acting as support.
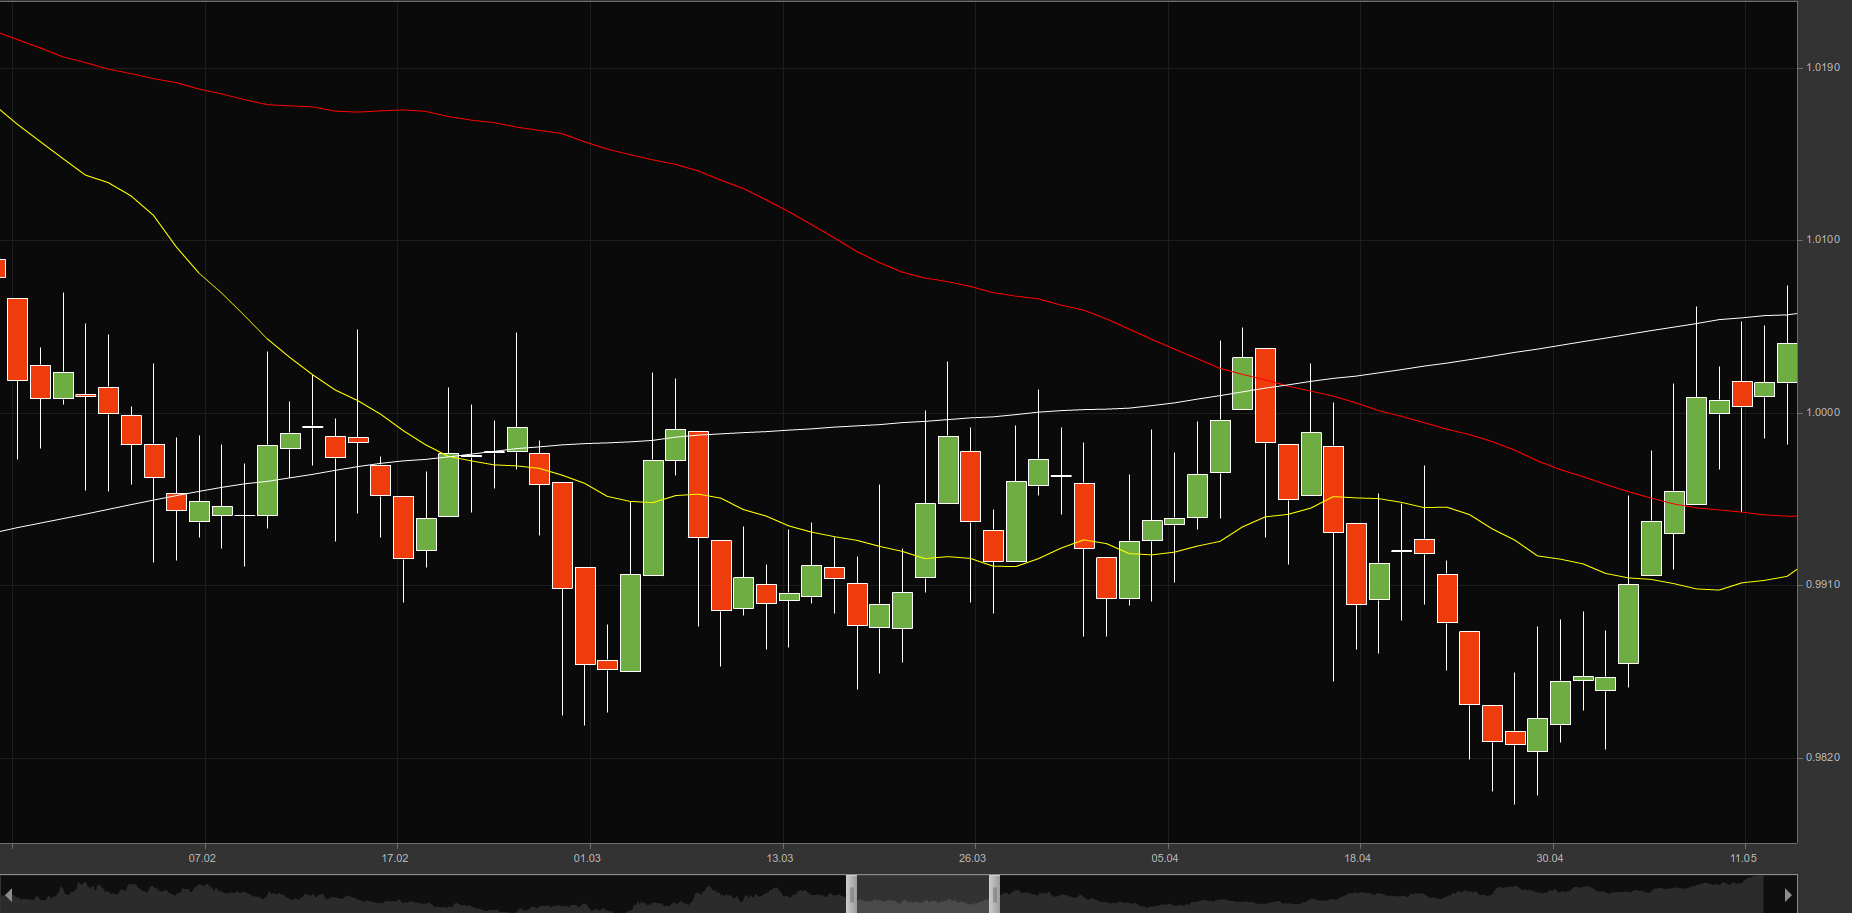
If current price action is below the moving average, it will act as resistance. The graph above shows how the same 200-day moving average is acting as resistance.