Correlations within the Forex market
You will learn about the following concepts
- Why is correlation important in trading?
- How to evaluate the correlation coefficient?
- How can these relations be applied in trading?
- and more…
Within the Forex market, certain relationships between currencies can be observed. Since currencies trade in pairs, they cannot be isolated from each other. To measure the strength of the relationship between currency pairs, a trader can use various statistical coefficients, one of the most popular of which is correlation.
Why is correlation important in trading?
 For a trader who trades several currency pairs on their account, it is vitally important to know how these pairs relate to each other. If a trader focuses on a single pair, this might not be so crucial. If some currency pairs are closely related and move together, a trader who trades both pairs can be exposed to significantly higher risk. Therefore, the correlation coefficient is a cornerstone of risk management.
How to evaluate the correlation coefficient?
 First, we need price quotes for a specific period for two different currency pairs. For example, we can evaluate the correlation between the daily charts of EUR/USD and GBP/USD from 1 September 2013. The quotes should cover the same time frame – daily EUR/USD to daily GBP/USD, weekly to weekly, and so on. Second, we will use Excel’s built-in CORREL function to estimate the correlation coefficient for the period 1 September to 31 October. We find that the correlation between these two pairs is 0.8911, or 89.11%. This is a significant correlation.
- Trade Forex
- Trade Crypto
- Trade Stocks
- Regulation: NFA
- Leverage: Day Margin
- Min Deposit: $100
| Date | EUR/USD | GBP/USD |
| Sep 02, 2013 | 1.3190 | 1.5546 |
| Sep 03, 2013 | 1.3172 | 1.5562 |
| Sep 04, 2013 | 1.3199 | 1.5620 |
| Sep 05, 2013 | 1.3119 | 1.5590 |
| Sep 06, 2013 | 1.3181 | 1.5631 |
| Sep 09, 2013 | 1.3256 | 1.5698 |
| Sep 10, 2013 | 1.3268 | 1.5731 |
| Sep 11, 2013 | 1.3314 | 1.5824 |
| Sep 12, 2013 | 1.3298 | 1.5803 |
| Sep 13, 2013 | 1.3297 | 1.5878 |
| Sep 16, 2013 | 1.3336 | 1.5902 |
| Sep 17, 2013 | 1.3356 | 1.5903 |
| Sep 18, 2013 | 1.3523 | 1.6133 |
| Sep 19, 2013 | 1.3534 | 1.6036 |
| Sep 20, 2013 | 1.3523 | 1.6005 |
| Sep 23, 2013 | 1.3496 | 1.6040 |
| Sep 24, 2013 | 1.3474 | 1.5994 |
| Sep 25, 2013 | 1.3518 | 1.6074 |
| Sep 26, 2013 | 1.3487 | 1.6038 |
| Sep 27, 2013 | 1.3522 | 1.6140 |
| Sep 30, 2013 | 1.3523 | 1.6187 |
| Oct 01, 2013 | 1.3523 | 1.6192 |
| Oct 02, 2013 | 1.3590 | 1.6236 |
| Oct 03, 2013 | 1.3623 | 1.6157 |
| Oct 04, 2013 | 1.3554 | 1.6009 |
| Oct 07, 2013 | 1.3581 | 1.6098 |
| Oct 08, 2013 | 1.3599 | 1.6119 |
| Oct 09, 2013 | 1.3519 | 1.5955 |
| Oct 10, 2013 | 1.3526 | 1.5975 |
| Oct 11, 2013 | 1.3540 | 1.5946 |
| Oct 14, 2013 | 1.3556 | 1.5972 |
| Oct 15, 2013 | 1.3521 | 1.5983 |
| Oct 16, 2013 | 1.3522 | 1.5946 |
| Oct 17, 2013 | 1.3668 | 1.6150 |
| Oct 18, 2013 | 1.3685 | 1.6167 |
| Oct 21, 2013 | 1.3673 | 1.6132 |
| Oct 22, 2013 | 1.3778 | 1.6231 |
| Oct 23, 2013 | 1.3778 | 1.6164 |
| Oct 24, 2013 | 1.3802 | 1.6198 |
| Oct 25, 2013 | 1.3805 | 1.6168 |
| Oct 28, 2013 | 1.3788 | 1.6140 |
| Oct 29, 2013 | 1.3742 | 1.6047 |
| Oct 30, 2013 | 1.3723 | 1.6024 |
| Oct 31, 2013 | 1.3579 | 1.6043 |
| correlation coefficient | 0.8911621711 | |
It is worth noting that high positive correlation values indicate that currency pairs move largely in the same direction, whereas negative values close to -1 show that they move equally but in opposite directions. If the correlation coefficient is close to 0, there is little relationship between the currency pairs and they move independently.
Correlation coefficients will also change if we use a different data set. In our example we used two months of data (1 September to 31 October); if we used a three-month set, we would almost certainly calculate a different coefficient.
Correlation is usually presented in a table or matrix. First, let us look at the correlation coefficients for the same time frame (two months) across multiple currency pairs. We use daily quotes for all pairs.
Daily Time Frame for 2 months | ||||
| EUR/USD | GBP/USD | USD/CHF | USD/JPY | |
| EUR/USD | 1 | 0.8911 | -0.9785 | -0.7899 |
| GBP/USD | 0.8911 | 1 | -0.93 | -0.7889 |
| USD/CHF | -0.9785 | -0.93 | 1 | 0.85 |
| USD/JPY | -0.7899 | -0.7889 | 0.85 | 1 |
By cross-referencing each column and row we obtain the correlation coefficient for the corresponding pairs. If we cross EUR/USD and GBP/USD, we see a coefficient of 0.8911. Because EUR/USD is compared with itself, the correlation coefficient is 1. Additionally, EUR/USD to GBP/USD shows the same relationship as GBP/USD to EUR/USD; therefore, their coefficient is identical.
Next, let us examine the correlation coefficients for one currency pair across different time frames.
| EUR/USD Correlation Coefficients | |||
| EUR/USD | GBP/USD | USD/CHF | USD/JPY |
| 1 week | 0.8163 | -0.9693 | -0.7767 |
| 1 month | 0.92 | -0.9882 | -0.7705 |
| 6 months | 0.5077 | -0.9585 | -0.1282 |
How can this be applied in trading?
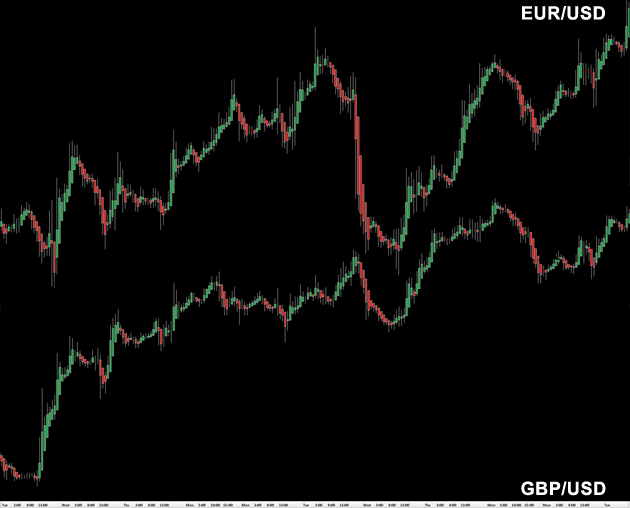
Here we are looking at one-hour charts of EUR/USD and GBP/USD. They move almost simultaneously. Consider the following scenario: a trader decides to open one position in EUR/USD and another in GBP/USD, believing this will diversify and reduce risk. However, this assumption is incorrect, because the high correlation between the pairs means that adding GBP/USD does not reduce risk at all. Entering both positions will in fact increase the trader’s risk, because the euro and the pound so often move in the same direction. With a correlation coefficient of 0.89, we can think of 1 lot of GBP/USD as roughly equivalent to 0.89 lot of EUR/USD. Opening 1 lot in EUR/USD and 1 lot in GBP/USD is therefore similar to opening 1.89 lots of EUR/USD. This means the trader has almost doubled their risk exposure.
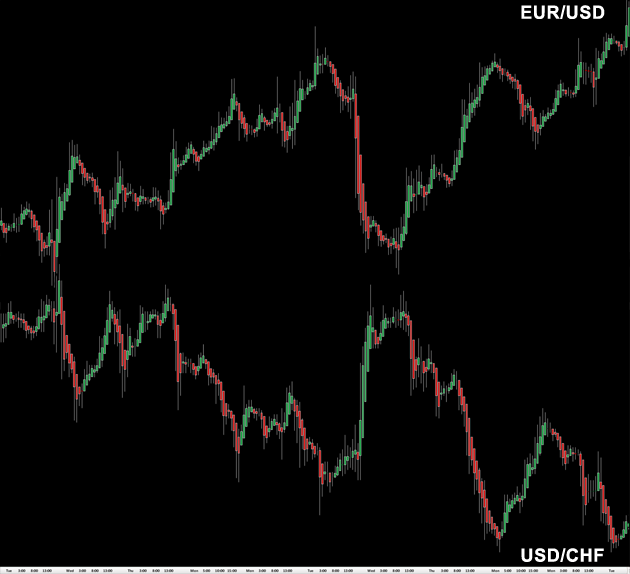
If a trader uses highly negatively correlated pairs (such as EUR/USD and USD/CHF on the one-hour chart below) and takes opposing positions, the effect is the same as taking positions in the same direction in highly positively correlated pairs. For example, entering a long position in EUR/USD and simultaneously a short position in USD/CHF is comparable to entering a long position in EUR/USD and another long position in GBP/USD, or to opening a long position in EUR/USD of twice the usual size.