Housing market
This lesson will cover the following
- How housing data affect currencies
- New Home Sales
- Pending Home Sales
- Existing Home Sales
- Housing Starts and Building Permits
- Interest Rate Sensitivity
Housing reports are the economic news data released by the United States Census Bureau, the National Association of Realtors, and Lloyds Banking Group in the United Kingdom regarding activity in the housing sub-sector of both economies. These data are an integral part of the economic news calendar of the Forex market.
Reports from these organisations include the numbers of new and existing homes purchased by consumers, pending orders, building permits, house prices and other housing data. They give traders information about the level of economic activity in the housing and mortgage sectors of an economy.
How housing data affect Forex?
 Housing data attracted a lot of attention in 2006, leading up to the global financial crisis in 2008, following the collapse of the mortgage market in the US, the UK, Europe and several other leading world economies. Since then, housing data have become a benchmark by which to measure economic performance in many countries and, as such, now exert a marked influence on the value of the currencies of the countries from which those data originate.
Given the effect that problems in the housing sub-sector had on financial markets, it is easy to see why housing data are now regarded as a barometer of economic performance. You can trade any of the following housing releases in the Forex market.
 The most important housing figures are New Home Sales (US), Existing Home Sales (US) and Pending Home Sales (US). Less significant, though still influential, information is provided by Housing Starts (US, Canada), Building Permits (US, Canada) and the Halifax House Price Index (UK).
With the USD traded against major currencies such as the EUR, GBP, AUD, CAD and CHF, a trader can position in the USD depending on whether the data released are positive or negative for the dollar.
- Trade Forex
- Trade Crypto
- Trade Stocks
- Regulation: NFA
- Leverage: Day Margin
- Min Deposit: $100
New Home Sales
 The United States Census Bureau publishes the New Home Sales economic indicator on its website on a monthly basis, towards the end of each month. The monthly rates are reported unadjusted; however, the annual rates are seasonally adjusted. The indicator records sales of newly constructed homes in the United States.
There are several points to watch out for when interpreting the New Home Sales numbers. First of all, the statistics do not record any houses that are not going to be sold immediately, for example a house commissioned to be built on an existing plot of land that the purchaser already owns.
Secondly, the statistics are taken at the point at which a customer has signed a sales contract or placed a deposit. At this stage the house can be at any point in its construction.
Thirdly, the sales figures are not adjusted to take into account sales contracts that are eventually cancelled by the builder or the customer. However, the same house is not included in any subsequent count when it is eventually sold to another customer.
This report has a considerable impact on the markets, as new home sales can trigger a rise in consumption. It is also an excellent indicator of economic downturns or upturns, owing to its sensitivity to consumer income. When new home sales fall over several months, this is usually a precursor to an economic depression.
The following graph shows the influence of a New Home Sales data release on EUR/USD. The report lagged forecasts, which triggered the upward move of the pair after 15:00 GMT, as you can see from the chart below.
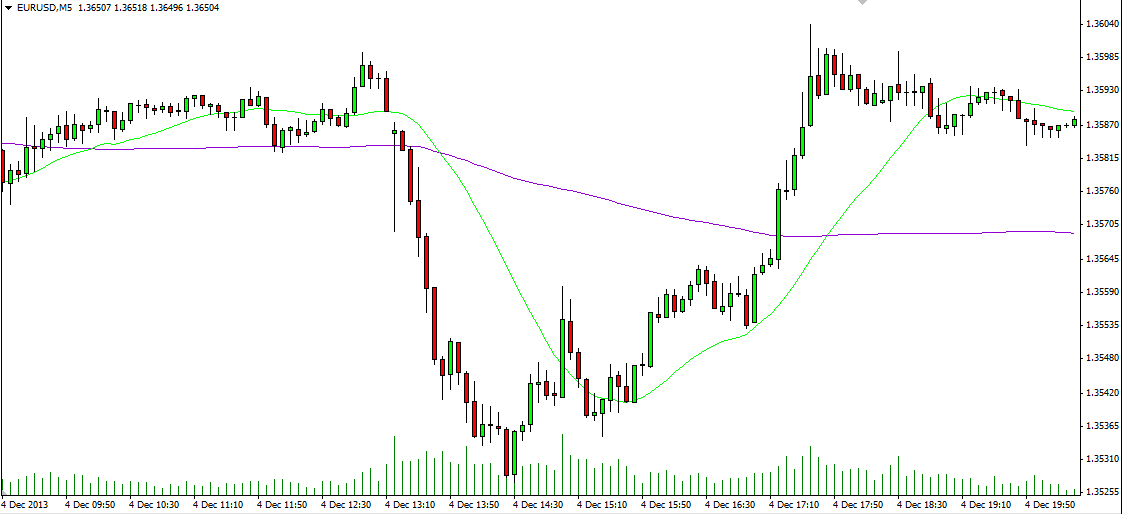
Source: MetaTrader 4 by MetaQuotes Software Corp.
Pending Home Sales
 The Pending Home Sales Index is a relatively new major indicator developed by the National Association of Realtors. It provides information on the number of future home sales that are in the pipeline. The index gathers data from estate agents and brokers at the point a sales contract is signed and is currently regarded as the most accurate indicator in the housing market. Pending home sales become actual home sales about two months later, so the index has genuine forecasting value.
How does the index work? When a sales contract is accepted for a property it is recorded as a pending home sale. This indicator is considered more accurate than other housing measures because it samples over 20% of the market. In addition, over 80% of pending home sales are converted to actual sales within two or three months. Although there are some cancellations, they are not sufficient to skew the data materially. The index base value is 100, and the base year is 2001, when home sales were at a high level.
Existing Home Sales
Also published by the National Association of Realtors (NAR), the index of Existing Home Sales is the third major gauge reflecting conditions in the US real-estate market. On or around the 25th of each month, the NAR releases data regarding sales and values of existing homes in the four major regions of the United States. The sample encompasses condominiums, co-ops and single-family houses.
Statistical data on Existing Home Sales are often used together with figures for New Home Sales and Pending Home Sales, the main objective being to determine how the economy and the nation’s housing sector are performing, irrespective of interest rates. The most active house-purchasing period in the United States is usually between March and June. Thus, if the data reveal a sudden drop in the number of homes sold during this period, it is considered a sign of weakness in the country’s housing market.
Limited impact
 The Existing Home Sales report usually does not have a direct impact on the US economy. This effect is minimal because nothing is produced with the mere sale of an existing home. In terms of economic activity, the sale of an existing house may relate only to interior design and the purchase of new furniture.
The New Home Sales report, however, tends to have a more considerable impact on the market. Sales of new homes are associated with significant economic activity and, in some cases, a resilient housing sector has the potential to pull an entire economy out of recession.
Markets pay particular attention to the Existing Home Sales report because it reveals much about the general course of the nation’s economy. A large proportion of the population views home ownership as a sign of wealth and, unlike financial wealth – which is concentrated in certain regions and held by the wealthiest segments of society – ‘housing wealth’ is more evenly distributed across the country.
Housing Starts and Building Permits
 Housing Starts and Building Permits are indicators of moderate importance and, as such, introduce only moderate volatility into the Forex market. Individuals can obtain these data from the Census Bureau of the US Department of Commerce; the reports are published around the 16th of each month. Economic calendars also provide timely information regarding the official figures.
Housing Starts measure the number of residential units on which construction has begun each month. A start in construction is defined as the laying of the building’s foundation and relates primarily to residential housing.
Building Permits are issued to allow excavation and construction. An increase in the number of Building Permits and Housing Starts usually occurs a few months after mortgage rates have been cut. Permits usually lead starts, but they are not required in all regions of the country, which is why the number of permits tends to be below that of housing starts over time.
Halifax House Price Index
 This indicator shows the change in real-estate and house prices in the UK. It is calculated by Lloyds Banking Group and has only limited influence on the online Forex market. Data on the Halifax House Price Index are published at the end of each month.
Interest Rate Sensitivity
 The housing market is considered the most interest-rate-sensitive sector of an economy. It often experiences pronounced changes in activity in response to movements in long-term interest rates, such as mortgage rates. Residential investment accounts for about 4% of the nation’s GDP. However, because of its volatility, it can provide a much larger proportion of changes in the GDP figure when relatively short time periods are considered. The housing sector is closely watched by policy-makers, as it may provide clues about macroeconomic performance in the short term and reveal the effects produced by changes in the financial environment.