Factory Orders, Industrial Production
This lesson will cover the following
- Factory Orders
- Durable Goods Orders
- Industrial Production and Capacity Utilisation
Factory Orders and Industrial Production are measures that provide an accurate picture of what is happening within the country’s industry. Although these two indicators have limited direct market influence, they may offer important signals to those able to interpret them successfully. In the following paragraphs, these indicators, along with their component sub-indicators, will be examined in detail.
Factory Orders
 Factory Orders is an economic indicator comprising two separate components: durable and non-durable goods orders.
Non-durable goods orders include items such as food, clothing, tobacco and other products that support the upkeep of durable goods. Factory orders data are reported monthly by the U.S. Department of Commerce. The report helps economists assess whether the economy is expanding.
An increase in factory orders may indicate economic expansion and could signal that inflation is rising. Because durable goods orders are released one or two weeks earlier, the Factory Orders report is fairly predictable; the non-durable component is the only new data. The Factory Orders report is usually not a major market mover, but it can attract attention when revised durable goods orders are included.
The report also contains information on factory inventories. While inventory figures themselves do not tend to move markets, economists use these numbers to help forecast inventory calculations for the quarterly GDP report. The Factory Orders report is released by the U.S. Census Bureau within the first few days of each month.
- Trade Forex
- Trade Crypto
- Trade Stocks
- Regulation: NFA
- Leverage: Day Margin
- Min Deposit: $100
Durable goods orders
 The Durable Goods Orders indicator gauges the strength of a country’s manufacturing sector and forms part of the Factory Orders report. It is closely watched because durable goods are the first type of products to be affected by an economic downturn or upturn. Durable goods are designed to last for three years or more and include aeroplanes, cars and buses, cranes, machine parts, appliances, etc. More than 85 industries are represented in the sample, which covers the entire United States.
The logic is that consumers must be considerably more optimistic to purchase a car than to buy daily necessities such as clothing. Therefore, these are among the first purchases to be postponed if the economy begins to contract. The same applies to corporate purchases: during a recession, an airline is less likely to buy new planes, and as a factory’s output contracts, it will be less inclined to invest in new machinery.
You should be careful to look through the high levels of volatility found within components of the Durable Goods report. Month-to-month changes should be compared with year-over-year figures and year-to-date estimates to identify the broader trends that characterise the business cycle.
To better visualise the effect of the Durable Goods Orders report on the forex market, examine the graph below. The EUR/USD pair rises between 12:00 and 13:00 GMT because the report prints negative numbers relative to both estimates and the previous period’s data. The euro appreciates against the dollar, which is why you see a fairly large green candle at this time.
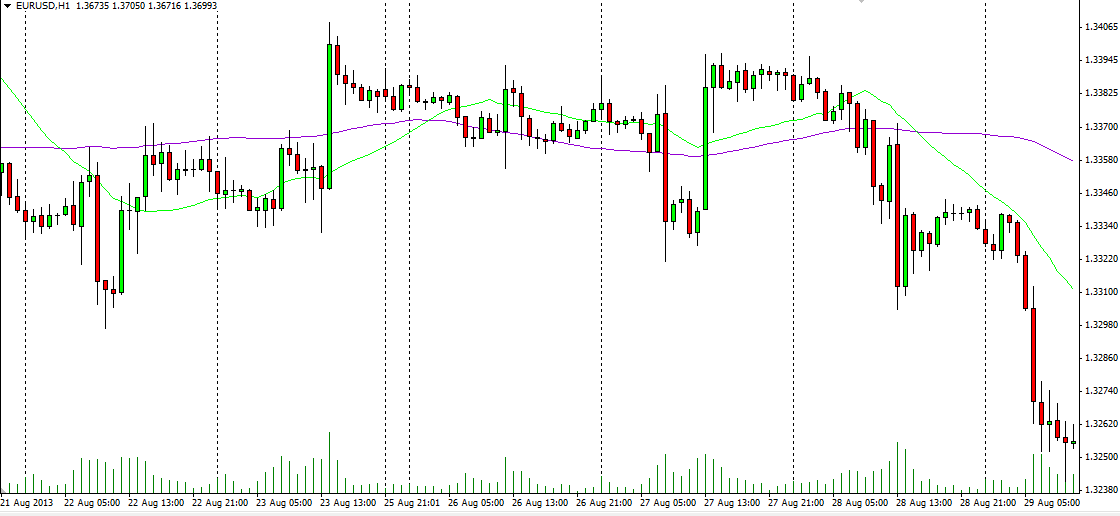
Source: MetaTrader 4 by MetaQuotes Software Corp.
Industrial Production and Capacity Utilisation
Industrial Production is released simultaneously with Capacity Utilisation data. The indicators measure the raw volume of goods produced by factories, mines and utilities in the US on a monthly basis. Industrial output also includes data from newspapers, periodicals and book-publishing businesses, traditionally regarded as part of the manufacturing sector.
The Industrial Production Index is sensitive to consumer demand and interest rates. As such, Industrial Production becomes an important tool for forecasting future GDP and economic performance. Central banks also use these figures to gauge inflation, as high levels of industrial production may lead to excessive consumption and rapid price growth.
 Industrial Production and Capacity Utilisation data are considered coincident indicators, meaning that changes in their levels generally mirror shifts in overall economic activity. They are expressed as percentage changes on a monthly and annual basis, providing information on short-term rates of change and business-cycle growth.
The Federal Reserve monitors these figures closely, as inflation typically appears first at the industrial level, when supplies of basic materials become scarce for manufacturers and their business clients. As the prices of raw materials begin to rise, these increases are passed up the chain, ultimately resulting in consumers paying more for finished products.
Capacity Utilisation
 Capacity utilisation measures how much of a company’s potential output is being achieved. The reading is expressed as a percentage, which could in theory reach 100%, and shows how much the company can increase production without incurring additional costs for building a new unit or facility. In practice, maximum output is rarely approached; utilisation levels above 82-85 percent are considered tight and can foreshadow supply shortages or price gains in the near future. Meanwhile, levels below 80% reflect slack in the economy, which can lead to falling employment and heightened recession concerns.
Although the rate of capacity utilisation is considered a critical gauge of economic momentum, the market does not entirely rely on this measure. Capacity utilisation is difficult to calculate, and the Fed tends to assume that capacity growth in any given year changes little, if at all.