Exponentially Smoothed Moving Average
This lesson will cover the following
- What is the so-called “drop-off effect”?
- How to estimate the value of an exponential moving average?
- SMA or EMA – which one to use?
The most criticised aspect of simple moving averages is the so-called “drop-off effect”. If the most recent price shows little change while the earliest price, now being dropped off, shows a significant change, the moving average can be affected by the removal of older data. Should a large change in the moving average occur as a result of the deletion of early data, this may generate a false signal.
Although very early data are not necessarily as relevant to future price movements as the most recent prices, they may still provide valuable information. The SMA completely ignores the older data that lie outside the length of the moving average. To retain this information in the calculation, technical analysts use the exponential moving average (EMA).
When calculating an SMA for a certain number of days, each day is given equal importance – equal weight – which means that each day’s data will have an identical impact on the value of the simple moving average. By contrast, an EMA assigns different weights depending on how recent the data are. The most recent data are given greater weight, while the earliest data receive less.
How to calculate an Exponential Moving Average?
Let us look again at the example presented in the previous article. We have calculated that a 10-day SMA has a value of 0.8921.
| Trading Day | Close Price |
| 1 | 0.87777 |
| 2 | 0.88196 |
| 3 | 0.89143 |
| 4 | 0.89649 |
| 5 | 0.90522 |
| 6 | 0.89942 |
| 7 | 0.88975 |
| 8 | 0.88993 |
| 9 | 0.89257 |
| 10 | 0.89665 |
| 10-day SMA | 0.89212 |
Assume that on the ninth day the AUD/USD pair closed not at 0.89257 but at a lower level, say 0.88488, owing to a disappointing retail sales report released in Australia. What impact would this have on the value of the SMA?
| Trading Day | Close Price |
| 1 | 0.87777 |
| 2 | 0.88196 |
| 3 | 0.89143 |
| 4 | 0.89649 |
| 5 | 0.90522 |
| 6 | 0.89942 |
| 7 | 0.88975 |
| 8 | 0.88993 |
| 9 | 0.88488 |
| 10 | 0.89665 |
| 10-day SMA | 0.89135 |
We can see that the value of the 10-day SMA has decreased because of a change in the data for only a single day. The tables above show how equally weighted data influence the overall value of the SMA. Because it is a short-term SMA, its value can change solely due to extraordinary price action in one day.
This effect can be smoothed out by using a different method of averaging – namely, the Exponential Moving Average. It can be calculated by using the following formula:
EMA (i) = EMA (i-1) + SF × [P(i) – EMA (i-1)], where
P(i) is the price in period (i), most often the closing price;
EMA(i) is the most recent value of the EMA;
EMA(i-1) is the previous EMA value;
SF is a smoothing factor, calculated as follows:
SF = 2/(n + 1), where n represents the number of periods used in the EMA.
| Trading Day | Total number of days (n) | Smoothing Factor | Close Price P (i) | EMA (i-1) | EMA (i) |
| 1 | 10 | 0.182 | 0.87777 | 0.89290 | 0.89015 |
| 2 | 10 | 0.182 | 0.88196 | 0.89533 | 0.89290 |
| 3 | 10 | 0.182 | 0.89143 | 0.89620 | 0.89533 |
| 4 | 10 | 0.182 | 0.89649 | 0.89613 | 0.89620 |
| 5 | 10 | 0.182 | 0.90522 | 0.89411 | 0.89613 |
| 6 | 10 | 0.182 | 0.89942 | 0.89293 | 0.89411 |
| 7 | 10 | 0.182 | 0.88975 | 0.89364 | 0.89293 |
| 8 | 10 | 0.182 | 0.88993 | 0.89447 | 0.89364 |
| 9 | 10 | 0.182 | 0.89257 | 0.89489 | 0.89447 |
| 10 | 10 | 0.182 | 0.89665 | 0.89450 | 0.89489 |
In the table above we have used exactly the same closing prices and candles as were employed when calculating the SMA in the previous article. Beginner traders should note that the EMA(i-1) value for the 10th day (which in our case is the earliest period) is the closing price of candle number 11, which precedes the ten successive closing prices in the table – namely, 0.89450. Thus, we begin constructing the table in a bottom-up manner. Now, let us look at the following graph:
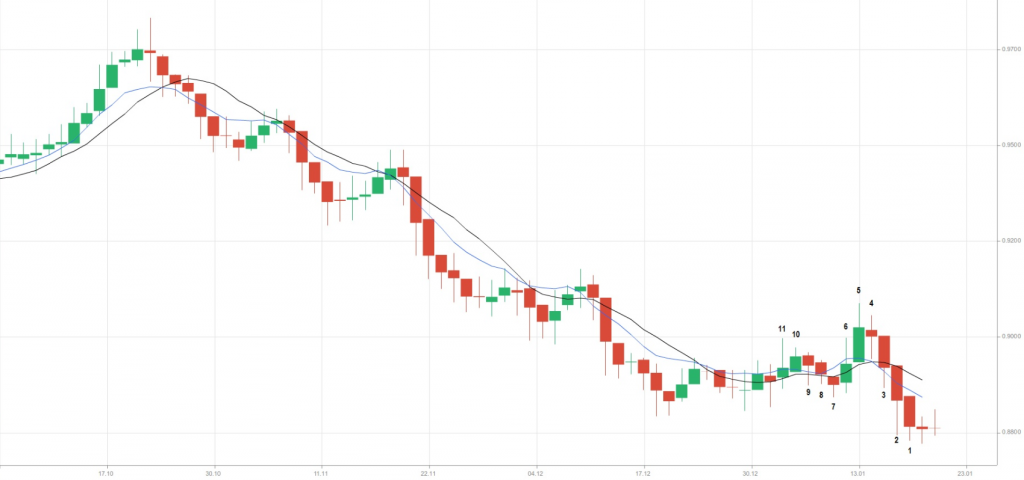
Here we can see a 10-day SMA (the black line) and a 10-day EMA (the blue line). Usually the EMA will change direction more rapidly than the SMA because of the additional weighting it assigns to the most recent data. The graph shows that during the most recent four periods (days) the EMA moves below the SMA. This is because the AUD/USD pair has shown a clear downward movement during these four days. Therefore, the EMA reflects the most recent sentiment more distinctly.
Notice that during the first 12 days (the 12 consecutive green candles to the left) the EMA remains above the SMA and then reacts earlier to the change in sentiment (the eight consecutive red candles). We can therefore say that the EMA better reflects what market participants are doing now than the SMA. This also explains why a number of oscillators use an EMA – most notably the MACD, which we shall discuss next.
- Trade Forex
- Trade Crypto
- Trade Stocks
- Regulation: NFA
- Leverage: Day Margin
- Min Deposit: $100
EMA or SMA – which to choose?
The EMA is more agile and usually reacts faster to changes in overall market sentiment and, consequently, price action, while the SMA responds more slowly. Thus, the SMA is better at smoothing out fake-outs and extraordinary price movements.
For a trader who uses shorter time frames and wishes to catch the trend quickly, the EMA will be the more appropriate choice. With the EMA he/she will be able to recognise and enter the trend earlier than when using the SMA. The downside is the higher probability of being stopped out (the trader’s stop-loss could be triggered) if a fake-out or unusual spike occurs. As the EMA reacts faster to the most recent price action, it could suggest that the trend has already reversed and that the trader should exit the position – probably at a loss. In the meantime, however, the market may continue its previous move in the direction of the trader’s position.
For a trader who uses longer time frames, the SMA will probably be a better choice because of its smoothness. Over the longer term, a trend usually lasts for an extended period, which makes immediate recognition less important. In this case a trader expects smooth movement and a muted reaction to unusual spikes, as such anomalies do not alter the underlying trend. The drawback can be missing a good entry point because the SMA tends to show a substantial delay after the trend has begun.
The bottom line is that different trading styles require different moving-average parameters. Short-term traders, who take around 25 trades per month, may use a 4-day SMA, while long-term traders, who take perhaps three to four trades per month, may use a 20-day EMA. Both trading styles can be almost equally effective, so we cannot say that a 4-day SMA is more appropriate than a 20-day EMA.
It again comes down to experimentation and practice. If a trader discovers that a moving average is the indicator that best suits his/her trading strategy, then he/she will need to spend time experimenting to decide which type of moving average and which period to use.