Double Top and Double Bottom formations
This lesson will cover the following
- What is a Double Top?
- How to trade a Double Top?
- What is a Double Bottom?
- How to trade a Double Bottom?
These formations both represent trend reversal opportunities.
Double Top
 The Double Top formation, also known as an ”M-shaped” pattern, is bearish in nature. It usually forms after prices have been in an uptrend, thus providing traders with an opportunity to sell.
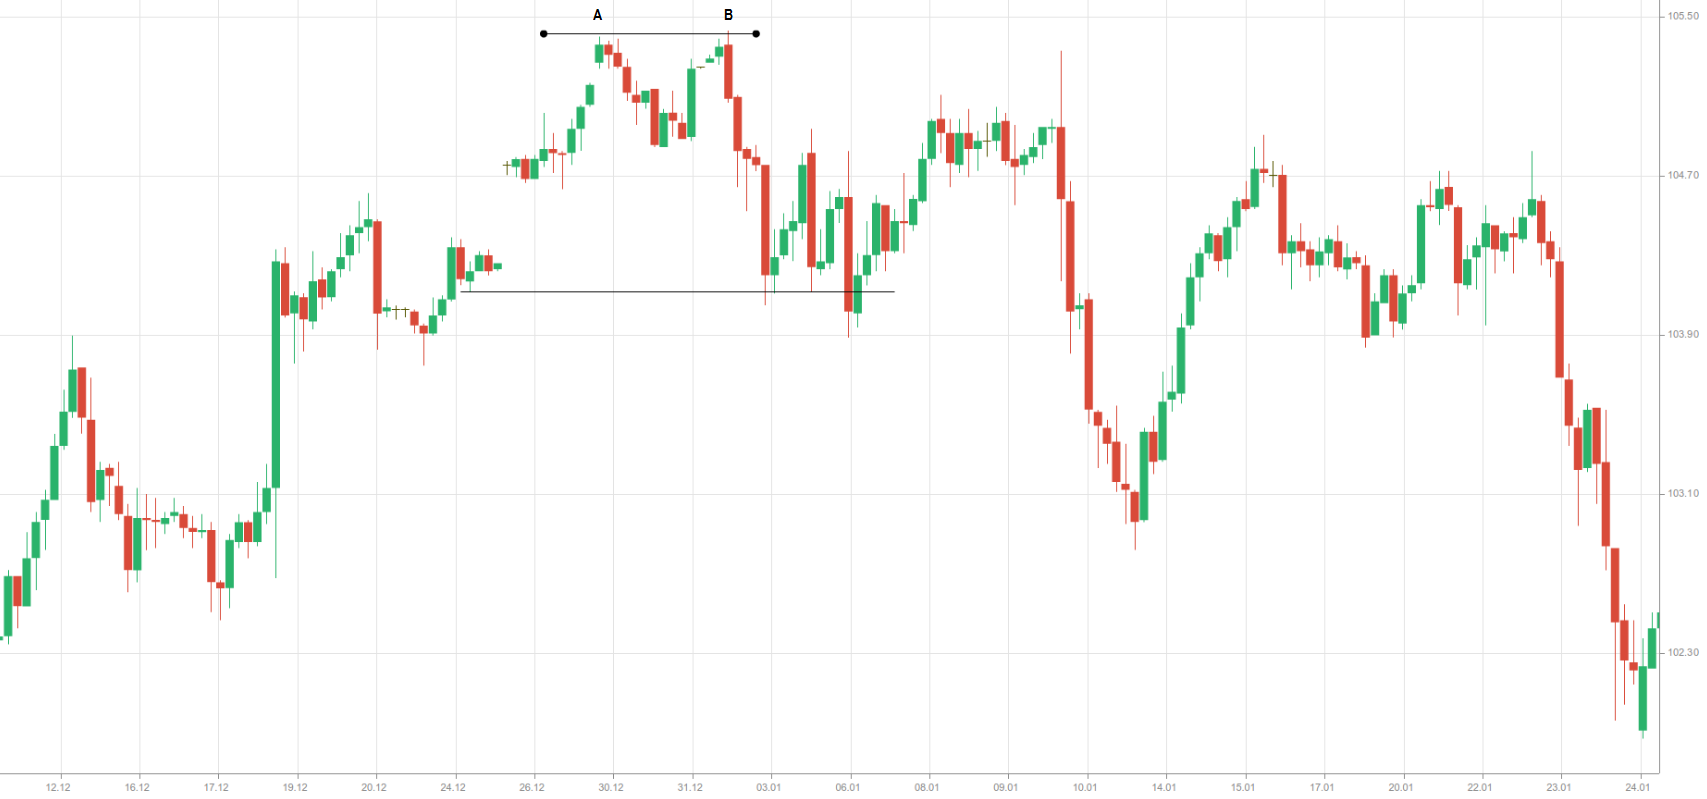
On the 4-hour chart of USD/JPY above, we can see that price action has formed two peaks, which are separated by a trough. A so-called ”neckline” can also be observed, representing the lower part of the formation.
For a pattern to qualify as a genuine Double Top, price must enter the formation from below the trough’s price level, while the exit should occur on a breakout below the trough’s low; in other words, the neckline needs to be broken.
The two peaks need to be identical, or within 5% of each other’s price level. The second peak may at times be slightly higher than the first.
Ideally, the retracement after the first peak will show the same number of candles as the move to the second peak; however, this is not 100% necessary.
The pattern is usually confirmed when price action closes below the bottom’s low.
The pattern usually fails when price action closes above the second peak.
This pattern may form over two to seven weeks. However, the longer the period, the less reliable it becomes. Patterns that perform best usually feature rounded peaks.
Let us look back at the chart to clarify what may have happened. Long-position traders may have tried to breach a resistance level (as shown at A) but failed as short-positioned players moved in. A second attempt was made by the longs, but it again failed to push prices to fresh highs because massive selling pressure was encountered (as shown at B). It therefore became evident that buyers would not be able to breach this strong resistance level, so prices turned downwards as more sellers opened positions.
- Trade Forex
- Trade Crypto
- Trade Stocks
- Regulation: NFA
- Leverage: Day Margin
- Min Deposit: $100
How to trade a Double Top?
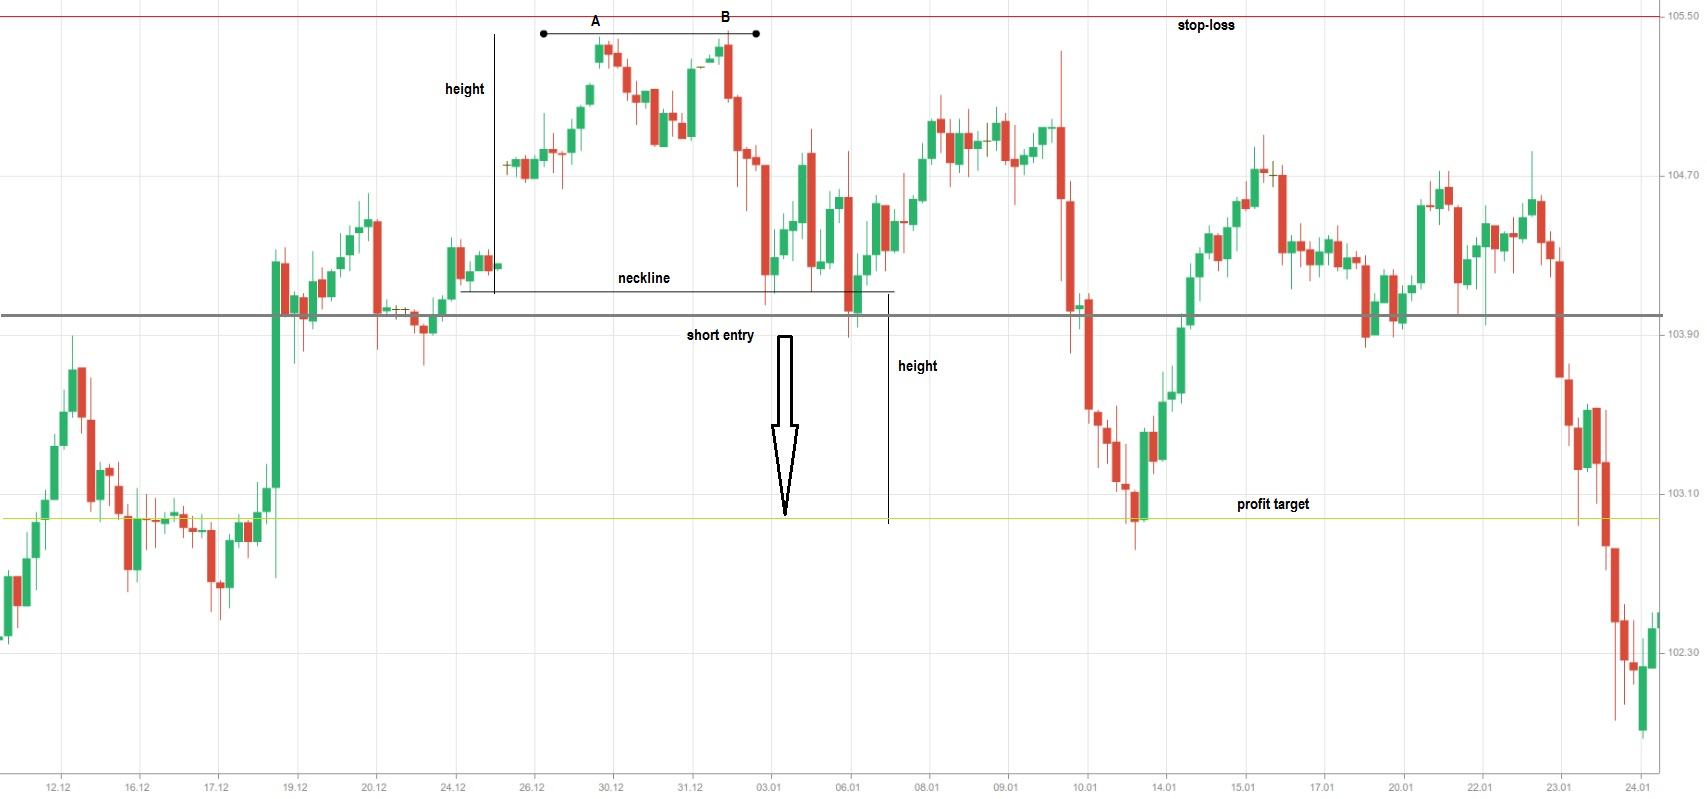
 A common way to trade a Double Top formation is to identify its ”neckline”. If the price breaches it, traders may enter a short position. A protective stop can be placed above the two peaks so that, if the pattern fails (prices continue to move above the second peak), losses are limited.
In order to estimate the profit target, traders may measure the height of the formation (the distance between the neckline and the higher of the two peaks) and project it downwards from the neckline. The 4-hour chart of USD/JPY below illustrates our short entry, protective stop and profit target when trading a Double Top.
Double Bottom
 The Double Bottom formation, also known as a ”W-shaped” pattern, is bullish in nature. It usually forms after prices have been in a downtrend, thus providing traders with an opportunity to buy.
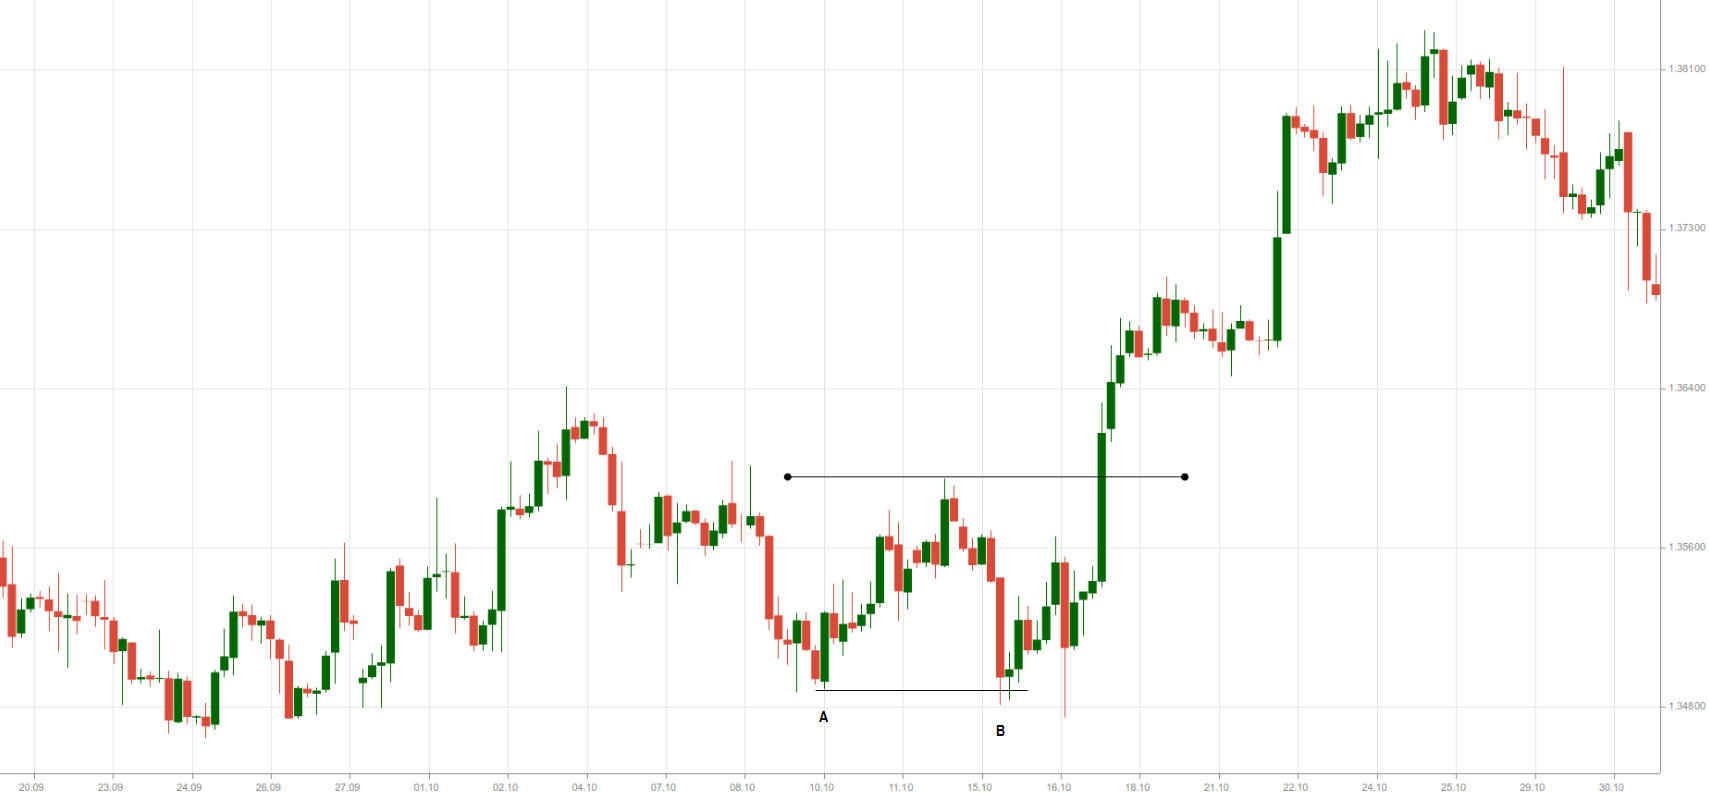
On the 4-hour chart of EUR/USD above, we can see that price action has formed two bottoms (troughs), which are separated by a peak. A neckline can again be observed, representing the upper part of the formation.
For a pattern to qualify as a genuine Double Bottom, the initial price needs to enter the formation from above the peak’s price level, and the exit should occur on a breakout above the peak’s high; in other words, the neckline must be breached.
The two bottoms need to be identical, or within 5% of each other’s price level. The second bottom may at times appear slightly lower than the first.
Ideally, the retracement after the first bottom will show the same number of candles as the move to the second bottom; however, this is not 100% necessary.
The pattern is usually confirmed when price action closes above the peak’s high.
The pattern usually fails when price action closes below the second bottom.
As with the Double Top, the longer the period of formation, the less reliable this pattern becomes. Formations that perform best usually feature rounded bottoms.
Let us look back at the chart. Long-position traders may have entered at a support level and blocked the attempt by short-positioned traders to force the price to lower levels (as shown at A). A second attempt was made by the shorts, but it failed because strong support was encountered once again (as shown at B). It therefore became apparent that sellers would not be able to breach this solid support level; consequently, prices turned upwards as more buyers opened positions.
How to trade a Double Bottom?
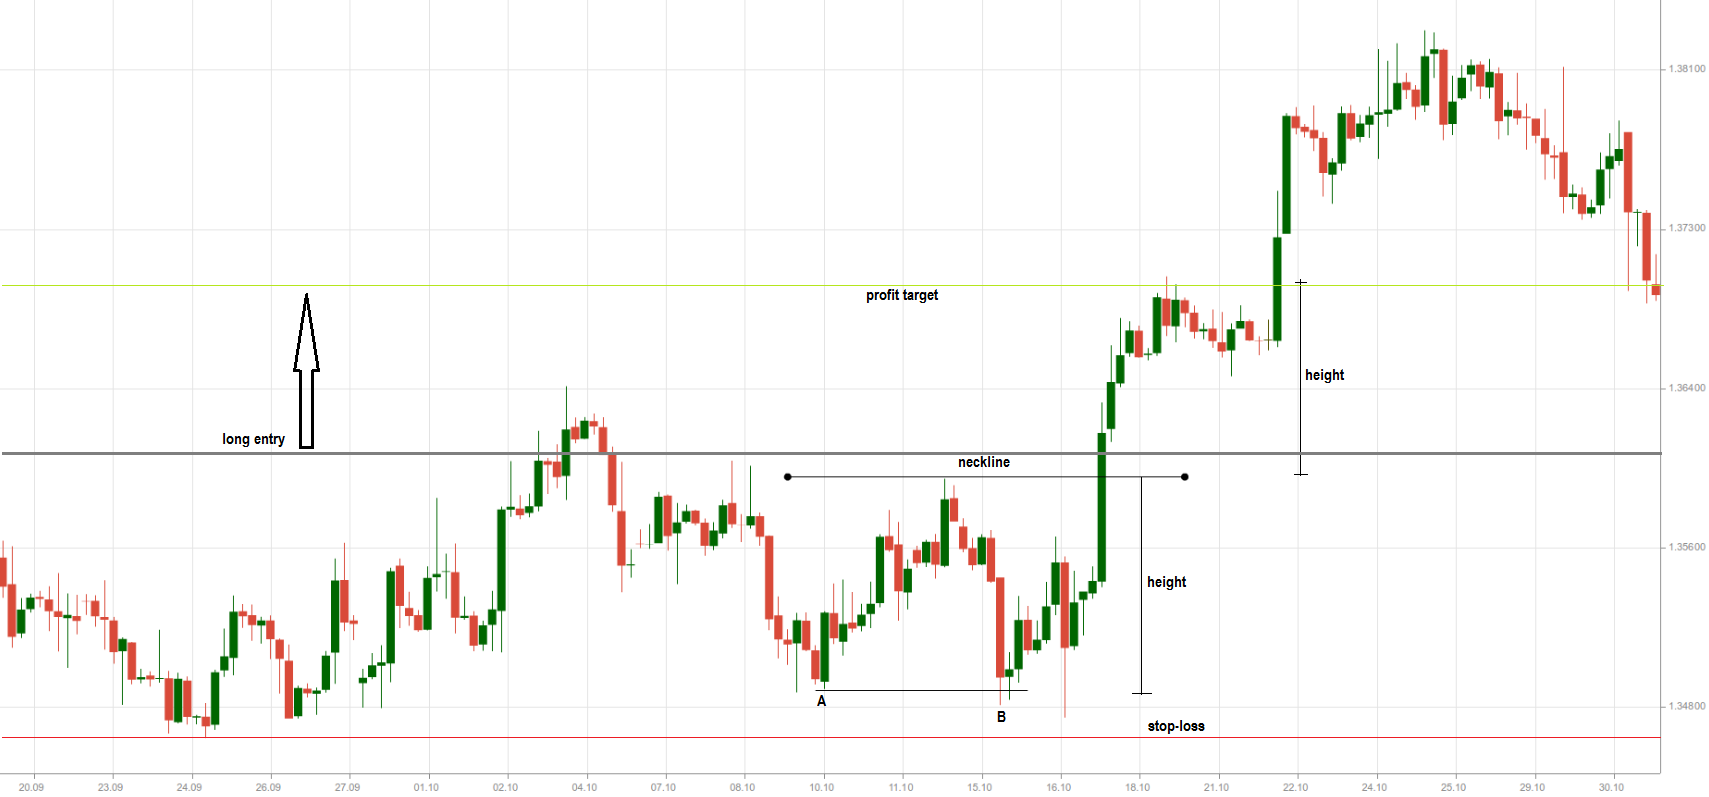
 A common way to trade a Double Bottom formation is to identify its ”neckline”. If the price breaches it, traders may enter a long position. A protective stop can be placed below the two bottoms so that, if the pattern fails (prices continue to move below the second bottom), losses are limited.
In order to estimate the profit target, traders may measure the height of the formation (the distance between the neckline and the lowest of the two bottoms) and project it upwards from the neckline. The 4-hour chart of EUR/USD below illustrates our long entry, our protective stop and our profit target when trading a Double Bottom.