Average True Range
This lesson will cover the following
- What is the Average True Range
- How the ATR is calculated
- What it shows you
- How to trade it
The Average True Range (ATR) is a volatility indicator that measures how much the price of an asset has moved over a certain number of periods; in other words, how volatile the asset is. It was created by J. Welles Wilder and was featured in his book “New Concepts in Technical Trading Systems”. Originally designed to capture gaps in commodities – because a volatility formula based solely on the high-low range would miss such movement – the ATR can also be used for stocks, indices and currencies.
Traders use the ATR to determine their profit targets and the optimal price levels for placing protective stops by estimating how far the asset may move in the future. The ATR is most commonly calculated on a 14-period basis, but as with most indicators it can be fine-tuned according to each trader’s unique trading system.
The ATR is a directionless indicator – basically a type of moving average of the asset’s price movement over a set period – which does not indicate trend direction. You can see how the ATR is visualised on a chart in the screenshot below.
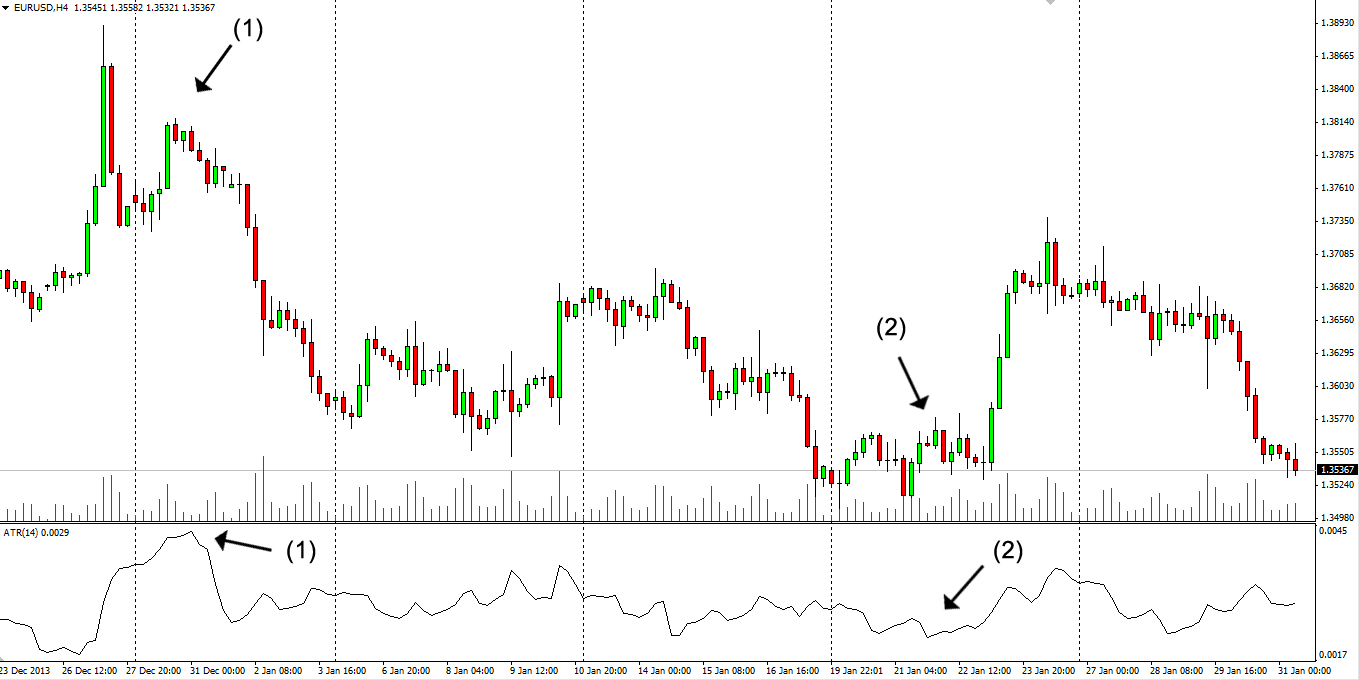
As you can see, the actual value is plotted in the top left-hand corner. We’ve used the default 14-period basis, which means that the average price movement over the last 14 four-hour periods is 29 pips. A trader can therefore expect the price to move within about 29 pips during the current period, giving a hint as to where profit targets and protective stops should be (we will discuss those a bit later in the article).
- Trade Forex
- Trade Crypto
- Trade Stocks
- Regulation: NFA
- Leverage: Day Margin
- Min Deposit: $100
When the line goes up, as in our example at (1), the indicator shows that volatility is rising, while a downward-tilting line, as at (2), indicates falling volatility. Low ATR values, especially over an extended period, are typical when the market trades sideways. The direction of the market trend is irrelevant.
How is the ATR calculated
 The Average True Range is calculated by determining the True Range for each included period and then averaging those values using the formula shown below.
The True Range is defined as the greatest of the following:
– The difference between the current high and the current low
– The difference between the current high and the previous close in absolute value
– The difference between the current low and the previous close in absolute value
The first scenario is used when the current high is above the previous period’s high and the current low is below the preceding period’s low (the previous candle is engulfed by the current one).
The second and third scenarios are used when a gap has occurred or the current period is engulfed by the previous period. Because Wilder was interested in measuring distance, not direction, absolute values are used.
After we’ve calculated the True Range for each of the periods in our look-back window, we add these values together and calculate their average (the ATR is a moving average of the TR values).
As mentioned earlier, the most commonly used – and the default on most trading platforms – setting is 14 periods. After we’ve estimated the ATR for the initial 14 periods, we use the following algorithm to determine future values:
Current ATR = [(Prior ATR × 13) + Current TR] / 14
How to trade the ATR
You’ve already learned that the Average True Range measures the degree of interest or disinterest in a price movement. Significant moves are often accompanied by large TRs, especially at the beginning of a move, while weak moves are followed by narrow ranges. This allows us to gauge the enthusiasm behind every move, including break-outs.
For example, a price reversal accompanied by an increase in the ATR value would suggest strong sentiment towards that move and reinforce the reversal, while a weak ATR reading would suggest proceeding with caution.
The same applies when the price breaks through a support or resistance level. If the break-out is supported by a rise in the ATR, it is most likely a genuine move; waning support from the indicator would suggest the break-out might be false.
Profit target
 Because the ATR measures how much the price of an asset has moved over a given number of periods, it can be used to anticipate how much the price may change in the future, giving us a hint as to where our profit target should be. If the indicator shows that the price has moved an average of 50 pips during the tracked period and the market has already exceeded those 50 pips during the current period, a price reversal becomes quite possible.
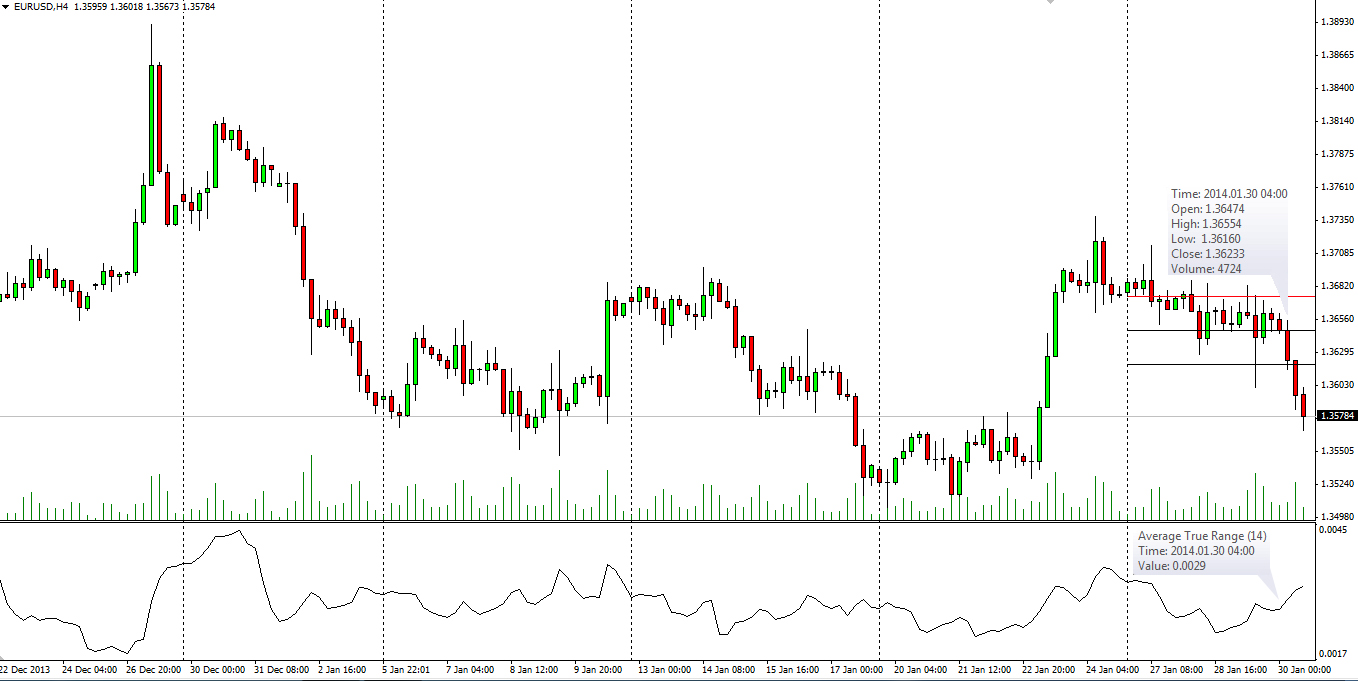
In the screenshot above you can see the price summary of a particular candle and the Average True Range for the same period. With the ATR showing a value of 29 pips, we can assume that at the time of the candle’s opening we could have expected it to remain within that range, or close to it, as indeed happened. Upon entering a short position, we set our profit target at 29 pips, which we would’ve achieved near the low of the candle.
Protective stop
 In the same way that the ATR is used for setting a profit target, it can serve as a tool for placing your stop-loss on the opposite side of the price action. If the average price range during the last 14 periods is 50 pips, you could set your protective stop 50 pips below or above the opening of the current period, depending on the type of position. In the example above, we set our stop-loss 29 pips above the opening price, as marked by the red line, because this is a short position.
Using the Average True Range when placing your stop-loss allows you to avoid random market noise more effectively. By setting the protective stop far enough from the entry point, in line with the ATR value, temporary price movements are unlikely to trigger it and close the position at a loss. Generally, the price will exceed the ATR value only for a valid reason, making this protective-stop system relatively immune to temporary random price movements.
If, however, the price action does turn against you, the ATR value will have provided one of the shortest stop-loss levels possible – minimising the negative effect on your account while still avoiding random noise.
Changing settings
 As we know, the most commonly used period for calculating the ATR is 14, just like with the Relative Strength Index. However, this setting is subject to change according to each trader’s uniquely tuned trading system. As with any other indicator, however, the larger the period of data included, the smoother the line that visualises the indicator will be. It will therefore produce fewer false signals, but the ones it does generate will most likely lag the price action. In the screenshot below we’ve illustrated how an ATR calculated on the basis of 28 periods (twice as many as usual) looks.

Logically, the ATR line will fluctuate much more each time we reduce the number of periods in the look-back. The fewer the periods, the more sensitive the ATR will be to recent price action, and it will give faster readings, but at the cost of more false signals. The same price action is shown below with the ATR period reduced so that you can compare the two scenarios.
As you can see, both of these settings deviate from the default level and don’t seem particularly suitable, especially for novice traders. We suggest that you first conduct extensive testing using the conventional 14-period time frame and then, if you are not satisfied, experiment with a setting that suits you best. But don’t forget to scrutinise any new setting thoroughly before incorporating it into your real-account trading strategy.