Yesterday’s trade saw USD/JPY within the range of 120.08-120.73. The pair closed at 120.56, up 0.10% on a daily basis and extending gains from Tuesday. It has been the most modest daily increase since September 10th, when the cross went up 0.08%.
At 7:56 GMT today USD/JPY was up 0.29% for the day to trade at 120.91. The pair overshot the upper range breakout level (R4), as it touched a daily high at 120.98 at 7:40 GMT.
Today the cross may be influenced by a number of macroeconomic reports and other events as listed below.
Fundamentals
United States
Initial, Continuing Jobless Claims
The number of people in the United States, who filed for unemployment assistance for the first time during the business week ended on September 11th, probably remained unchanged at 275 000, according to market expectations. It has been the lowest number of claims since the business week ended on August 22nd, when 271 000 claims were reported.
The 4-week moving average, an indicator lacking seasonal effects, was 275 750, marking an increase of 250 compared to the preceding weeks revised down average.
The business week, which ended on September 4th has been the 27th consecutive week, when jobless claims stood below the 300 000 threshold. This continues to support the case labor market conditions in the country follow the path of improvement.
Initial jobless claims number is a short-term indicator, reflecting lay-offs in the country. In case the number of claims met expectations or dropped further, this would have a moderate bullish effect on the US dollar.
The number of continuing jobless claims probably remained unchanged at the seasonally adjusted 2 260 000 during the business week ended on September 4th, or staying close to a 15-year low. This figure represented an increase by 1 000 compared to the revised up number of claims, reported in the business week ended on August 21st. This indicator reflects the actual number of people unemployed and currently receiving unemployment benefits, who filed for unemployment assistance at least two weeks ago.
The Department of Labor is to release the weekly report at 12:30 GMT.
Housing Starts, Building Permits
The number of housing starts in the United States probably dropped to 1.170 million units in August, according to market expectations, from the seasonally adjusted annual rate of 1.206 million during the prior month. The latter has been the highest level since October 2007, when 1.232 million housing starts were reported. Julys increase in housing starts was supported by single-family houses (an increase by 12.8% to 782 000). On the other hand, starts of buildings with five units or more fell 17.1% to reach 413 000. Housing starts in the Northeast marked the largest drop in July (-27.5%), followed by those in the West (-3.1%). At the same time, housing starts in the Midwest went up 20.1% in July and those in the South were up 7.7%.
Housing starts represent a gauge to measure residential units, on which construction has already begun every month. A start in construction is defined as the foundation laying of a building and it encompasses residential housing primarily.
The number of building permits in the country probably increased to 1.160 million in August from an annual level of 1.119 million in July. The latter has been the lowest number of permits since March 2015, when a level of 1.039 million was reported. Single-family authorizations fell at a monthly rate of 1.9% to 679 000 units in July, while permits of units in buildings with five units or more were reported to have dropped 32.6% to 412 000.
Building permits are permits, issued in order to allow excavation. An increase in the number of building permits and housing starts usually occurs a few months after mortgage rates in the country have been reduced. Authorizations are not required in all regions of the United States. Building permits, as an indicator, provide clues in regard to demand in the US housing market. In case a higher-than-anticipated figure is reported, this will support demand for the US dollar. The official housing data are due out at 12:30 GMT.
Philadelphia Fed Index
The Philadelphia Fed Manufacturing Index probably decreased to a reading of 6.0 in September from 8.3 index points during the previous month. The index is based on a monthly business survey (the Business Outlook Survey), measuring manufacturing activity in the third district of the Federal Reserve, Philadelphia. Participants give their opinion about the direction of business changes in overall economy and different indicators of activity in their companies, such as employment, working hours, new and existing orders, deliveries, inventories, delivery time, price etc. A level above zero is indicative of improving conditions, while a level below zero is indicative of worsening conditions. Lower-than-expected index readings would have a moderate bearish effect on the greenback. The Federal Reserve Bank of Philadelphia is expected to release the official results from the survey at 14:00 GMT.
FOMC policy decision
The Federal Open Market Committee (FOMC) will probably keep its target for the federal funds rate unchanged within the range 0%-0.25% for a 53rd consecutive meeting, according to the median forecast by experts. Policymakers have recently indicated that the necessary macroeconomic conditions for the first rate hike in a decade were not yet present, but were approaching.
At the same time, 64% of business leaders, participated in a survey by the National Association of Manufacturers last week, suggested the time for a hike has not yet come. However, there have been other opinions, according to which a measured rate increase would bring about beneficial effects.
”A nominal interest increase would signal that we’re on our way to normalization,” said the CEO of Polaris Industries Inc (PII.N), a producer of outdoor sports equipment employing 7 000 people worldwide, cited by Reuters. According to him, ”a rising interest rate environment” is usually indicative of thriving economy.
According to extracts from the minutes of the FOMCs most recent meeting on policy: ”While the recent Chinese stock market decline seemed to have had limited implications to date for the growth outlook in China, several participants noted that a material slowdown in Chinese economic activity could pose risks to the U.S. economic outlook. Some participants also discussed the risk that a possible divergence in interest rates in the United States and abroad might lead to further appreciation of the dollar, extending the downward pressure on commodity prices and the weakness in net exports.”
”…participants mentioned a number of considerations associated with the timing and pace of policy normalization. Most judged that the conditions for policy firming had not yet been achieved, but they noted that conditions were approaching that point. Participants observed that the labor market had improved notably since early this year, but many saw scope for some further improvement. Many participants indicated that their outlook for sustained economic growth and further improvement in labor markets was key in supporting their expectation that inflation would move up to the Committees 2 percent objective, and that they would be looking for evidence that the economic outlook was evolving as they anticipated.”
”…participants expressed support for emphasizing that the course of policy would remain conditional on the Committees assessment of economic developments and the outlook relative to its objectives. It was also noted that the Committees communications around the time of the first rate increase should emphasize that the expected path for policy, not the initial increase, would be the most important determinant of financial conditions and should acknowledge that policy would continue to be accommodative to support progress toward the Committees dual objectives.”
”…the economic conditions warranting an increase in the target range for the federal funds rate had not yet been met. Members generally agreed that additional information on the outlook would be necessary before deciding to implement an increase in the target range. One member, however, indicated a readiness to take that step at this meeting but was willing to wait for additional data to confirm a judgment to raise the target range.”
The FOMC will announce its official decision on policy at 18:00 GMT. A rate hike would surely skyrocket the US dollar. The rate decision will be followed by a press conference with Fed Chair Janet Yellen at 18:30 GMT.
Japan
BoJ meeting Minutes
At 23:50 GMT Bank of Japan will release the minutes from its meeting on policy, held on September 15th. The minutes offer a detailed insight on the central bank’s monetary policy stance. This release is closely examined by traders, as it may provide clues over interest rate decisions in the future. Moderate-to-high volatility is usually present after the publication. In case the minutes show a hawkish outlook, this usually supports the yen, while a dovish outlook usually has a bearish effect on the national currency.
The Bank of Japan kept its pledge to expand the monetary base at an annual pace of about JPY 80 trillion yen at its most recent meeting. According to bank officials, the economy continued to recover at a moderate rate, regardless of that exports and output are influenced by a slowdown in emerging economies.
According to extracts from the central banks September policy statement: “Japans economy is expected to continue recovering moderately. The year-on-year rate of increase in the CPI is likely to be about 0 percent for the time being, due to the effects of the decline in energy prices.”
“Risks to the outlook include developments in the emerging and commodity-exporting economies, the prospects regarding the debt problem and the risk of low inflation rates being protracted in Europe, and the pace of recovery in the U.S. economy.”
“Quantitative and qualitative monetary easing (QQE) has been exerting its intended effects, and the Bank will continue with the QQE, aiming to achieve the price stability target of 2 percent, as long as it is necessary for maintaining that target in a stable manner. It will examine both upside and downside risks to economic activity and prices, and make adjustments as appropriate.”
Bond Yield Spread
The yield on Japanese 2-year government bonds went as high as 0.028% on September 16th, or the highest level since May 7th (0.029%), after which it slid to 0.022% at the close to gain 0.006 percentage point on a daily basis, while marking a second consecutive trading day of increase.
The yield on US 2-year government bonds climbed as high as 0.819% on September 16th, or the highest level in more than a year, after which it fell to 0.815% at the close to add 1.3 basis points (0.013 percentage point) for the day. It has been the third consecutive trading day of gains.
The spread between 2-year US and 2-year Japanese bond yields, which reflects the flow of funds in a short term, expanded to 0.793% on September 16th from 0.786% during the prior day. The latter has been the most notable spread since July 2nd, when the difference was 0.875%.
Meanwhile, the yield on Japans 10-year government bonds soared as high as 0.394% on September 16th, or the highest level since September 4th (0.396%), after which it slid to 0.380% at the close to appreciate 1.7 basis points (0.017 percentage point) compared to September 15th, while marking a second straight day of gains.
The yield on US 10-year government bonds climbed as high as 2.303% on September 16th, or the highest level since July 30th (2.322%), after which it slipped to 2.298% at the close to add 2.2 basis points (0.022 percentage point) on a daily basis, while marking a second consecutive day of gains.
The spread between 10-year US and 10-year Japanese bond yields widened to 1.918% on September 16th from 1.913% during the prior day. The September 16th yield difference has been the largest one since July 14th, when the spread was 1.936%.
Daily and Weekly Pivot Levels
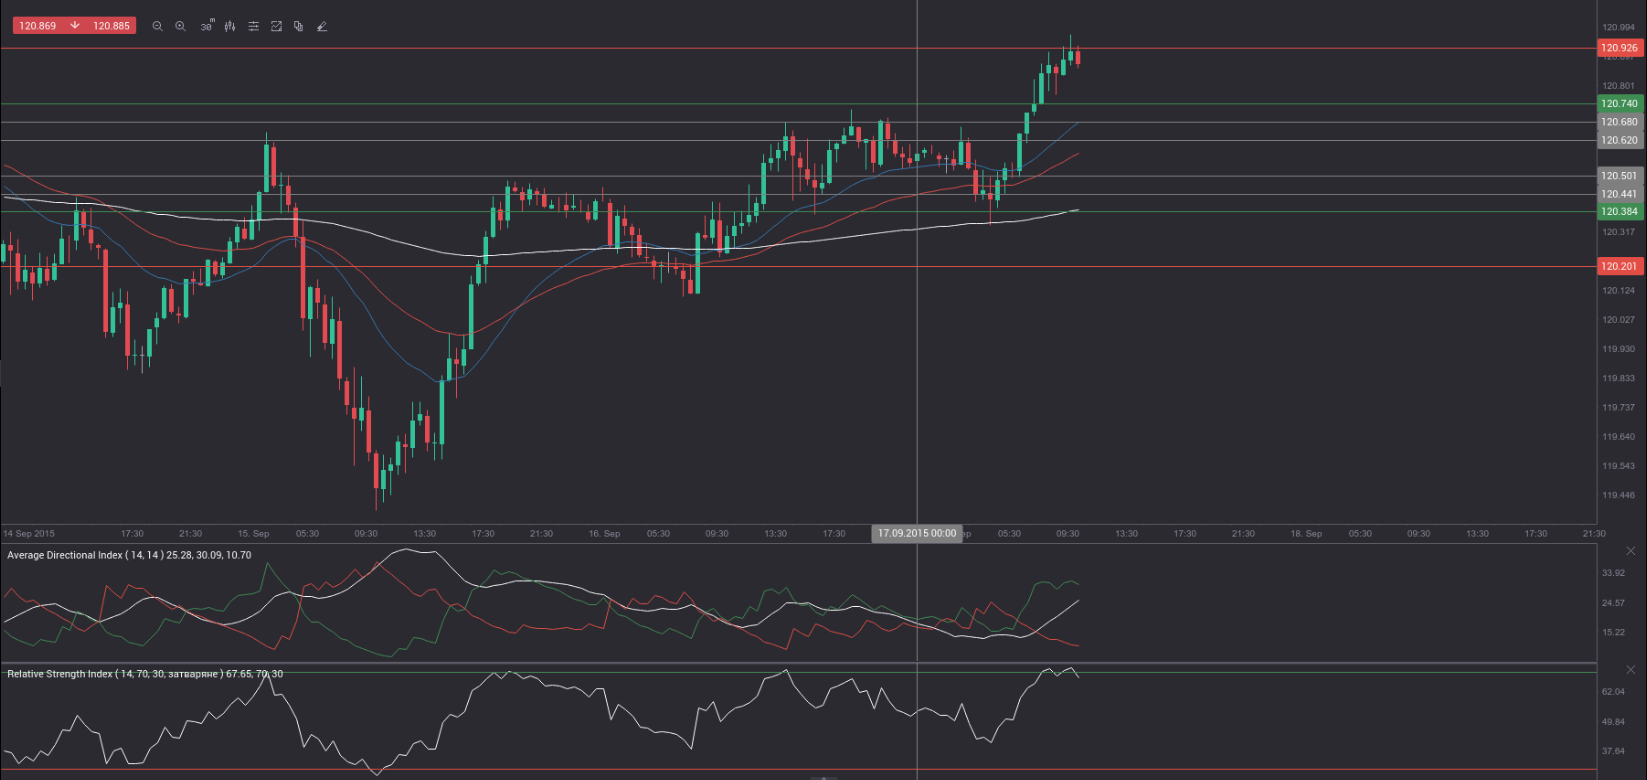
By employing the Camarilla calculation method, the daily pivot levels for USD/JPY are presented as follows:
R1 – 120.62
R2 – 120.68
R3 (range resistance – green on the 30-minute chart) – 120.74
R4 (range breakout – red on the 30-minute chart) – 120.92
S1 – 120.50
S2 – 120.44
S3 (range support – green on the 30-minute chart) – 120.38
S4 (range breakout – red on the 30-minute chart) – 120.20
By using the traditional method of calculation, the weekly pivot levels for USD/JPY are presented as follows:
Central Pivot Point – 120.19
R1 – 121.74
R2 – 122.89
R3 – 124.44
S1 – 119.04
S2 – 117.49
S3 – 116.34