Friday’s trade saw USD/JPY within the range of 124.02-124.56. The pair closed at 124.31, dipping 0.09% on a daily basis, or the smallest daily loss since August 3rd, when it slipped a mere 0.02%. In weekly terms, the cross added 0.07% last week, which marked the third weekly gain in a row.
At 8:33 GMT today USD/JPY was up 0.15% for the day to trade at 124.47. The pair is set to test the upper range breakout level (R4), as it touched a daily high at 124.57 at 7:25 GMT. It has been the highest level since August 13th, when a daily high of 124.64 was reached.
Today the cross may be influenced by a number of macroeconomic reports as listed below.
Fundamentals
United States
New York Empire State Manufacturing Index
The New York Empire State Manufacturing Index probably increased to a reading of 5.00 in August, according to the median forecast by experts, from 3.86 in the prior month. If so, this would be the highest index level since February, when a value of 6.90 was reported.
The index is based on the monthly Empire State Manufacturing Survey, which is conducted by the Federal Reserve Bank of New York. About 200 top manufacturing executives respond to a questionnaire, sent out during the first day of the month. They provide their estimates in regard to the performance of several business indicators from the prior month, while also forecasting performance during the upcoming six months.
The ”general business conditions” component of the index is based on a distinct question, posed on the Empire State Manufacturing Survey, which means it is not a weighted average of the other indicators. These indicators, which are only applicable to the manufacturing facilities of survey respondents in the region of New York, include new orders, shipments, unfilled orders, delivery time, inventories, prices paid, prices received, number of employees including contract workers, average employee work week, technology spending and capital expenditures.
The general business conditions component and the sub-indexes for the 11 indicators are calculated by subtracting the percentage of respondents, rating an indicator as ”lower” (a drop), from the percentage of respondents, rating the same indicator as ”higher” (an increase). In case 33% of survey respondents stated that business conditions had improved during the current month, 50% stated that conditions had not changed, and 17% of the respondents stated that conditions had deteriorated, the index would have a reading of 16. Readings above 0.00 are indicative of improving business conditions in the region. Higher-than-anticipated index values will usually have a moderate bullish effect on the US dollar. The Federal Reserve Bank of New York is expected to release the official reading at 12:30 GMT.
NAHB Housing Market Index
The National Association of Home Builders (NAHB) Housing Market Index probably rose a third consecutive month in August, reaching 61.0, according to market expectations, from 60.0 in July. If so, this would be the 14th consecutive month, when the gauge stood in the area above 50.0, and also the highest index value in more than 8 years. The indicator is based on a monthly survey in regard to current home sales and expected sales in the coming six months. Values above the key level of 50.0 indicate that housing market conditions are good. Therefore, higher-than-projected readings would provide support to the greenback. The official data is scheduled for release at 14:00 GMT.
Correlation with other Majors
Taking into account the week ended on August 16th and the daily closing levels of the major currency pairs, we come to the following conclusions in regard to the strength of relationship:
USD/JPY to USD/CHF (0.9576, or very strong)
USD/JPY to USD/CAD (0.5658, or strong)
USD/JPY to NZD/USD (-0.4189, or moderate)
USD/JPY to AUD/USD (-0.6371, or strong)
USD/JPY to EUR/USD (-0.7526, or strong)
USD/JPY to GBP/USD (-0.8283, or very strong)
1. During the examined period USD/JPY moved almost equally in one and the same direction with USD/CHF, while moving almost equally in the opposite direction compared to GBP/USD.
2. USD/JPY moved strongly in the opposite direction compared to EUR/USD and AUD/USD during the past week.
3. USD/JPY moved strongly in one and the same direction with USD/CAD during the period in question.
4. The correlation between USD/JPY and NZD/USD was moderate.
Bond Yield Spread
The yield on Japanese 2-year government bonds went as high as 0.007% on August 14th, after which it slid to 0.006% at the close to lose 0.001 percentage point on a daily basis.
The yield on US 2-year government bonds climbed as high as 0.738% on August 14th, or the highest level since August 10th (0.741%), after which it fell to 0.726% at the close to gain 1.7 basis points (0.017 percentage point) for the day, while marking a second consecutive trading day of increase.
The spread between 2-year US and 2-year Japanese bond yields, which reflects the flow of funds in a short term, expanded to 0.720% on August 14th from 0.702% during the prior day. The August 14th yield spread has been the most notable one since August 5th, when the difference was 0.720%.
Meanwhile, the yield on Japans 10-year government bonds soared as high as 0.389% on August 14th, or the highest level since August 11th (0.420%), after which it slid to 0.380% at the close to lose 0.006 percentage point compared to August 13th.
The yield on US 10-year government bonds climbed as high as 2.221% on August 14th, or the highest level since August 11th (2.232%), after which it slipped to 2.201% at the close to add 1.2 basis points (0.012 percentage point) on a daily basis, while marking a third consecutive day of gains.
The spread between 10-year US and 10-year Japanese bond yields widened to 1.821% on August 14th from 1.803% during the prior day. The August 14th yield difference has been the largest one since August 10th, when the spread was 1.824%.
Daily and Weekly Pivot Levels
By employing the Camarilla calculation method, the daily pivot levels for USD/JPY are presented as follows:
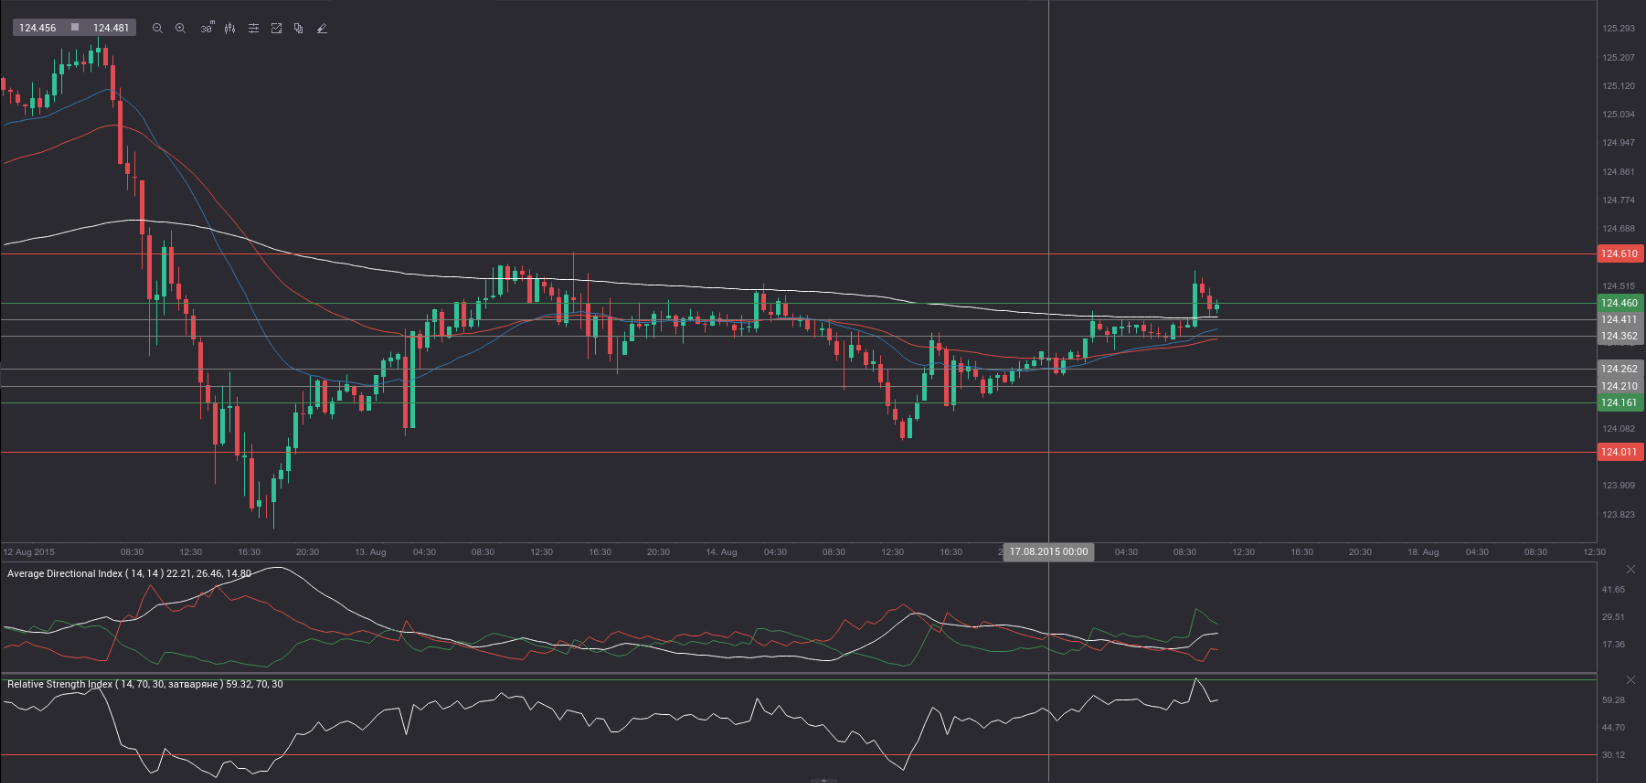
R1 – 124.36
R2 – 124.41
R3 (range resistance – green on the 30-minute chart) – 124.46
R4 (range breakout – red on the 30-minute chart) – 124.61
S1 – 124.26
S2 – 124.21
S3 (range support – green on the 30-minute chart) – 124.16
S4 (range breakout – red on the 30-minute chart) – 124.01
By using the traditional method of calculation, the weekly pivot levels for USD/JPY are presented as follows:
Central Pivot Point – 124.46
R1 – 125.15
R2 – 125.99
R3 – 126.68
S1 – 123.62
S2 – 122.93
S3 – 122.09