Elliott Wave oscillator
This lesson will cover the following
- Definition
- Interpretation
Developed by Ralph Nelson Elliott, author of the Elliott Wave Theory, the Elliott Wave Oscillator is an indicator used to determine where one Elliott wave ends and the next begins. It aims to offset one of the Elliott Wave Theory’s main weaknesses – reliance on accurate wave counting.
The Elliott Wave Oscillator has a strong correlation with Elliott wave patterns, and its highest readings typically show where the third wave appears on the chart. The EWO can be applied to any time frame and will work equally well if the sample size is large enough.
The Elliott Wave Oscillator, also known as the 5/34 oscillator, is essentially the result of subtracting the 34-period simple moving average (SMA) from the 5-period SMA. It is displayed as a histogram divided into two areas – positive and negative. The following screenshot shows its visualisation.
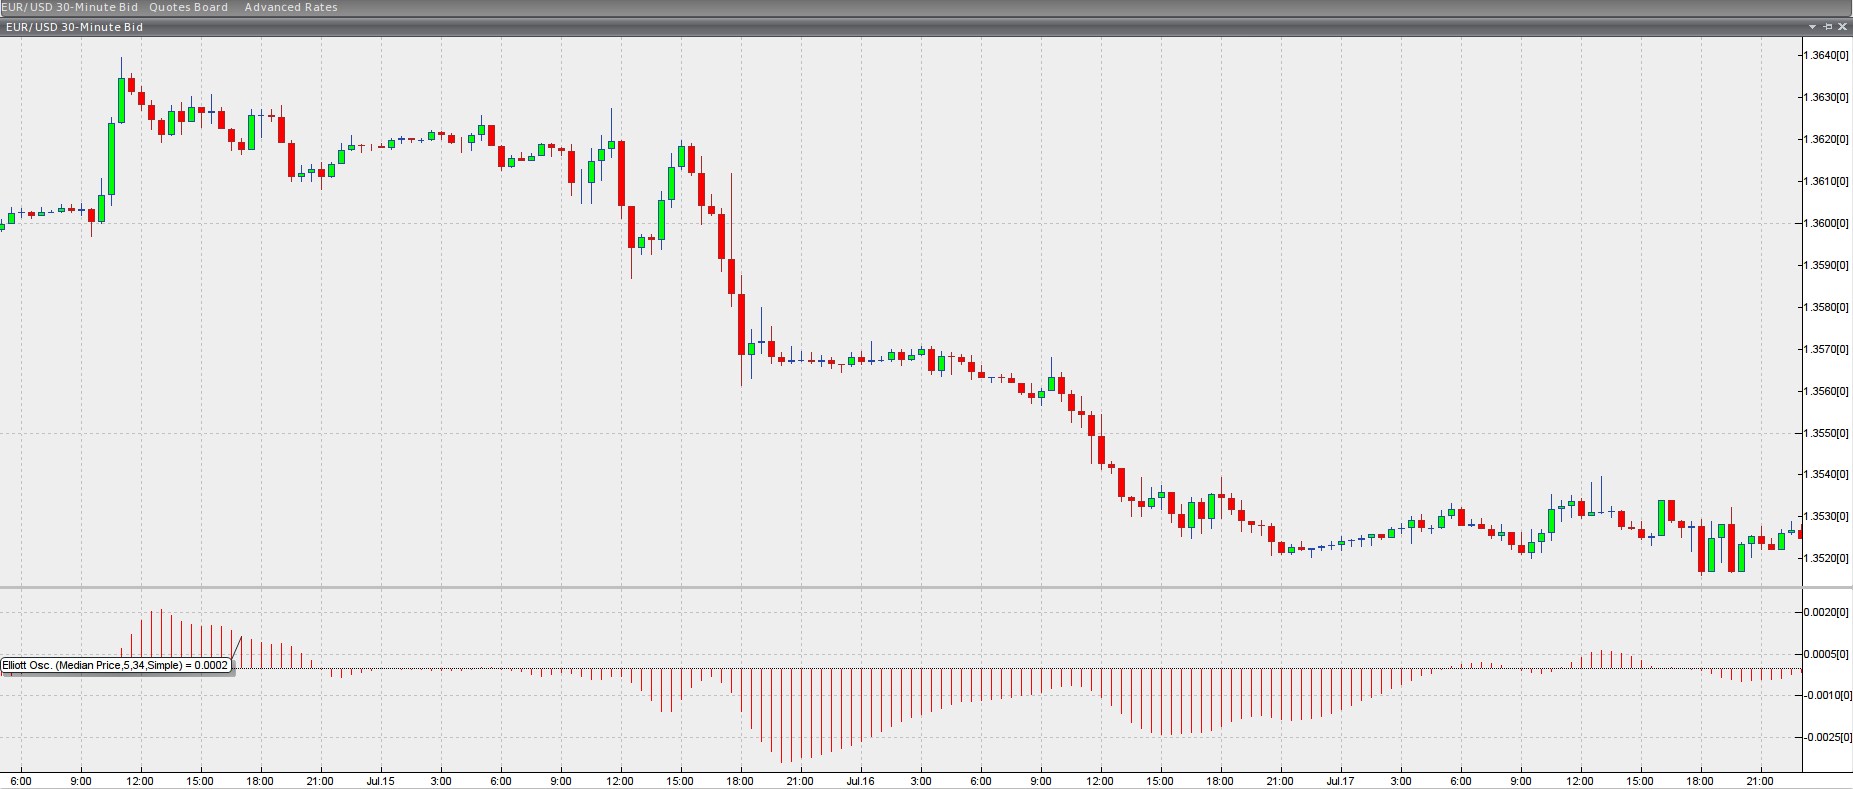
Chart source: VT Trader.
There are several important concepts related to the EWO.
- Trade Forex
- Trade Crypto
- Trade Stocks
- Regulation: NFA
- Leverage: Day Margin
- Min Deposit: $100
In general, wave 1 usually begins with a trend reversal. Wave 2, which, as we know, is a correction to wave 1, typically does not reach a new extreme in the counter-trend direction (e.g., a swing low in an uptrend) but retraces a considerable portion of wave 1. As you know, wave 4 is the other corrective wave during the with-trend momentum, so a second major correction in the Elliott Wave Oscillator will most likely be wave 4.
The end of wave 2 is logically followed by the beginning of wave 3. As mentioned above, the most important aspect of trading with this indicator is remembering that its highest and lowest readings identify a bullish or bearish wave 3 of the swing.
Wave 3 is the point at which you should have identified the pattern and must act. Because the EWO does not signal exit points, when you enter with the trend around the start of wave 3, you should aim for a profit target of 100%-161% of the length of wave 1.
Wave 4 usually reverses the oscillator and crosses into the opposite area beyond zero, becoming negative during a bull trend and positive during a bear trend.
The price typically reaches a new high during wave 5, but it diverges from the oscillator; i.e., in a bull trend the price records a higher high while the EWO prints a lower high. The opposite applies in a bear trend. This divergence signals that the pattern is nearing completion and the trend is coming to an end. The subsequent reversal is often followed by the formation of a new wave 1 in the opposite direction.
If, however, there is no evident divergence, the suspected wave 5 is probably false and should be regarded as an extended wave 3. In that case, what we believed to be wave 4 is nothing more than a pullback within the larger wave 3. A protracted wave 3 indicates a major price movement in the direction of the trend, which is expected to continue for some time.