Trading trend line bounces
You will learn about the following concepts
- Indicators used with this strategy
- Signals to look for
- Entry point
- Stop-loss
- Profit target
The strategy we are about to share with you is based on trend following, which, as we have said many times throughout our guides, is the most secure way to trade. This trading system does not require any additional tools, although using the Zig Zag indicator (Swing ZZ) makes it visually easier to identify the swing highs and lows required for the strategy’s implementation.
Because this system is based on trend following, it will be ineffective and produce false signals when the market is trading sideways. Thus, we need to confirm that a strong trend is in motion, which can be done either by using a moving average with a large look-back period of 80 periods or more, or by determining the major trend on a higher time frame (multiple-time-frame analysis). Specifically for this strategy we will use the latter, and you can learn more about it in our article “Positioning based on analysing different time frames“.
The idea behind this strategy is to determine the major and current trends well enough to make entries based on the minor trend’s swing highs or lows, but only in the direction of the larger trend. Because swing highs and lows act as key support and resistance levels, increasing the chance that the price will bounce off them, positioning according to them is the essence of this trading system. So, let us begin with the specifics.
- Trade Forex
- Trade Crypto
- Trade Stocks
- Regulation: NFA
- Leverage: Day Margin
- Min Deposit: $100
We begin by determining the major trend. To reduce the effect of whipsaws, this strategy is best used on larger time frames, 30 minutes or higher. If we choose to trade on the 30-minute chart, we should switch to the hourly chart for a better grasp of the situation and then even to the 4-hour time frame for a complete view of the big picture. If you see that the market is not trending, but instead holding in a range, you should avoid entering any trade until a breakout occurs and a trend is formed. If a strong trend is present, you should draw trend lines on the higher time frames and then switch to the 30-minute chart. This will help you keep track of price development.
This strategy relies on swing highs and lows in the current trend to determine your entry and exit points. Thus, in a bullish trend, when the price drops to the trend line and rebounds, you must enter with a buy stop or market order several pips (5-10) above the high of the bar that rebounded from the trend line.
Conversely, in a bearish trend, you must enter short with a stop or market order 5-10 pips below the low of the bar that touched the trend line. In both cases (long and short), this can be the 30-minute trend line, but also the 1-hour and 4-hour ones, as they all act as significant resistance/support levels.
The stop-loss should be placed several pips (again 5-10) below the most recent swing low when entering a long position, or above the most recent swing high if the trend is bearish. Some traders might prefer other capital-protection strategies; it is all up to them.
As a profit target you should use the most recent swing high for a long position, or the most recent swing low for a short entry.
Regarding trade management, you have several options. You can exit the entire position upon reaching the profit target (the most recent swing high or low), or you can keep the whole position and move your stop-loss 5-10 pips below or above the newly formed swing high/low. You can also scale out, leaving only a portion of the position, and trail your stop to each new bar’s high/low as the trend continues to move in your direction. Check out the following example.
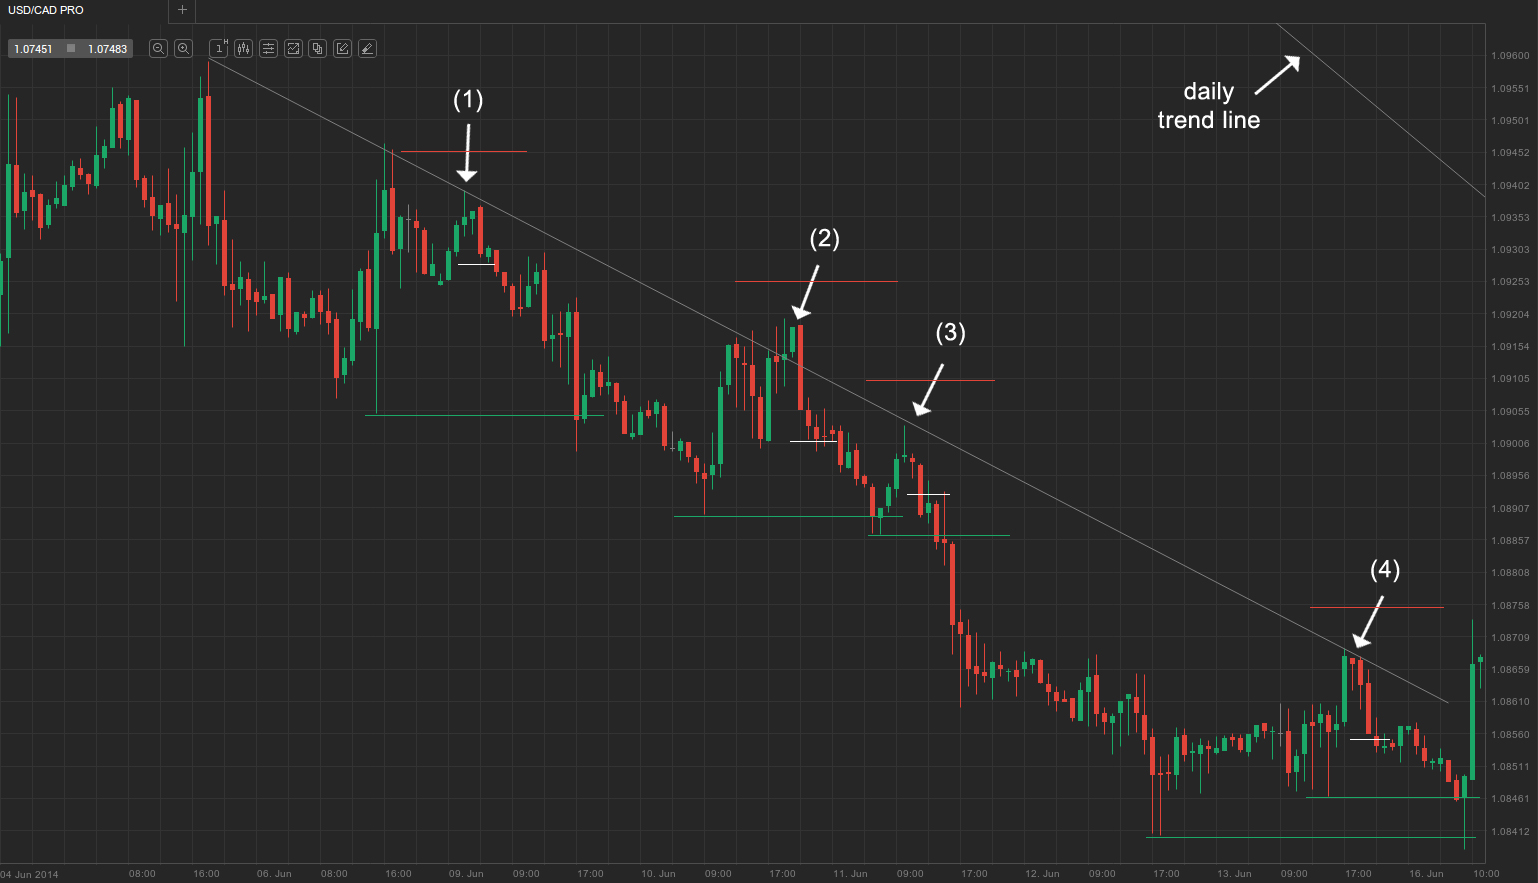
In the example above you can see a clear bearish trend, which was also confirmed by the daily time frame (the daily trend line running down is shown in the upper right-hand corner). The market began forming lower highs which, when connected, formed a downward trend line. At bar (1), we should be fairly sure of the existence of the downtrend, and we enter on a sell stop order several pips below the low of bar (1) (the white horizontal line). Our profit target is the previous swing low, as marked by the green line, while our stop-loss order is placed 5-10 pips above the bar’s high.
At bar (2), the market overshot the trend line only for the bearish trend to accelerate afterwards. Proof of the bears’ determination to continue the move is the huge double-shaved bear bar, which penetrated back through the trend line and extended the trend. We again enter 5-10 pips below it and aim for a profit target at the previous swing low. At bar (3), the market undershot the trend line, but it was close enough to treat as a short signal, and we enter again 5 pips below its low. Our next entry is at bar (4), which reached two profit targets – the previous two swing lows.