Gaps, trading pullbacks after gaps
This lesson will cover the following
- What are gaps
- What do gaps signify
- Types of gaps
- Trading the gaps
In this article, we will present a fairly basic gap-trading strategy based on support and resistance zones and their ability to switch roles. If you want to learn more about support and resistance levels, read our articles ‘Support and Resistance, Part I’ and ‘Support and Resistance, Part II’, as well as ‘Support and Resistance Levels in Weak Trends’.
Let’s say a few words about gaps before jumping to the trading strategy itself. Gaps are periods of trading during which a currency, stock or another financial instrument makes a sharp move up or down, accompanied by very little trading. On the chart, this is visualised by a gap between two consecutive bars.
Gaps are most common in stock trading because, unlike the forex market, stock markets close each day and any events that occur during the closure may result in the price opening higher or lower compared with the most recent close. The resulting gap creates a new array of trading opportunities, owing to the different ways traders interpret and trade gaps. In most cases, when it comes to companies and their share price, gaps form following the announcement of major corporate news or the release of significant reports while the stock markets are closed. At the start of the next session, if the released data was unexpected, it often causes a gap.
- Trade Forex
- Trade Crypto
- Trade Stocks
- Regulation: NFA
- Leverage: Day Margin
- Min Deposit: $100
In the forex market, on the other hand, gaps are most often seen at the opening of the market on Sunday evening. Because the forex market is decentralised, and thus operates around the clock, it rarely forms gaps during the working week. Instead, you can observe gaps between the closing exchange rate on Friday and the opening value on Sunday. A currency pair rarely gaps during the week, and if it does it is usually by only a couple of pips. Here, gaps appear in intraday trading charts as large candles and form when an economic report causes a sharp move up or down that is not accompanied by sufficient liquidity.
Types of gaps, filling of gaps
 We can classify four different types of gaps:
– Continuation gaps – they form in the middle of a trend and reflect a rise in the number of market players who place with-trend entries.
– Exhaustion gaps – they form near the end of a trend and reflect with-trend market players’ attempts to push the market to a final extreme, after which the trend usually reverses or enters a trading range.
– Breakaway gaps – they occur at the end of a trend and signify the beginning of a new one.
– Ordinary gaps – also known as common gaps – cannot be placed at the beginning or end of any trend or pattern, and thus have little or no predictive value.
The trading strategy we are about to explain, step by step, is based on the price retracing after the gap, or, as we will call it, after the gap is filled. The gap is said to be filled after the price, which previously gapped, reverses and pulls back to the pre-gap level. These retracements are very common and happen for several reasons.
First, as the price breaks out and reaches a new swing high or low, many traders lock in profits because they think the move was overdone and will soon reverse. At the same time, many other market players begin to fade the swing extreme because they think they can reverse the market. Second, because the gap is a breakout through a resistance/support zone, which then plays the opposite role once the gap is filled, there are no other major resistance/support zones between the breakout point and the swing extreme. Thus, there is nothing that could halt the filling. Also keep in mind that identifying the type of gap is crucial for predicting whether it will be filled – exhaustion gaps get filled as they are followed by a trend reversal, but breakaway and continuation gaps are not faded.
Typically, due to the lack of midway support and resistance levels, when a gap starts filling it will most often complete the retracement. Volume also plays an important role in determining what kind of gap we have and, therefore, how the market might move next. Exhaustion gaps are usually accompanied by low volume, while breakaway and continuation gaps typically occur on high volume.
Trading the gap
 Each trader has a unique perspective of market movement and a different view on how a certain move should be traded. As we said, some traders will buy the breakout as soon as it occurs, while others will fade it when a new swing high is reached. Others will wait for the gap to be filled and enter in the original direction once the previous support/resistance zone has switched roles. We will turn our attention to the latter strategy.
First of all, as with almost every other trading strategy we have discussed, we will limit our scope to with-trend entries only. Therefore, we will use multiple time-frame analysis to determine the larger trend and enter only in its direction on the smaller time-frame chart. For our example, we will trade on a 15-minute timeframe while determining the general market direction on an hourly chart.
We then need to identify a gap that breaks through a major resistance or support zone on the 15-minute timeframe and afterwards gets filled (retraces back to its pre-gap level). Let’s say we have a bullish gap. If the gap is filled and the price falls back to the former resistance zone but, instead of penetrating it, rebounds, this means that the resistance is now acting as support. Thus, we have a breakout pullback, which is a second long entry signal (the first one was the breakout itself), and secondary entries are more reliable than the primary ones.
In order to enter long in this situation, we need to see the price reverse from the support zone and, as soon as a candle closes above it, we can enter in the direction of the gap.
However, before entering we need to have predetermined our stop-loss level and profit target. We can place our protective stop either several pips below a nearby major support/resistance level (the several pips are meant to protect the stop from being triggered by random noise) or at the most recent swing low (respectively swing high for a short position). As for the profit target, you should aim to reach the gap’s high. Check out the example below.
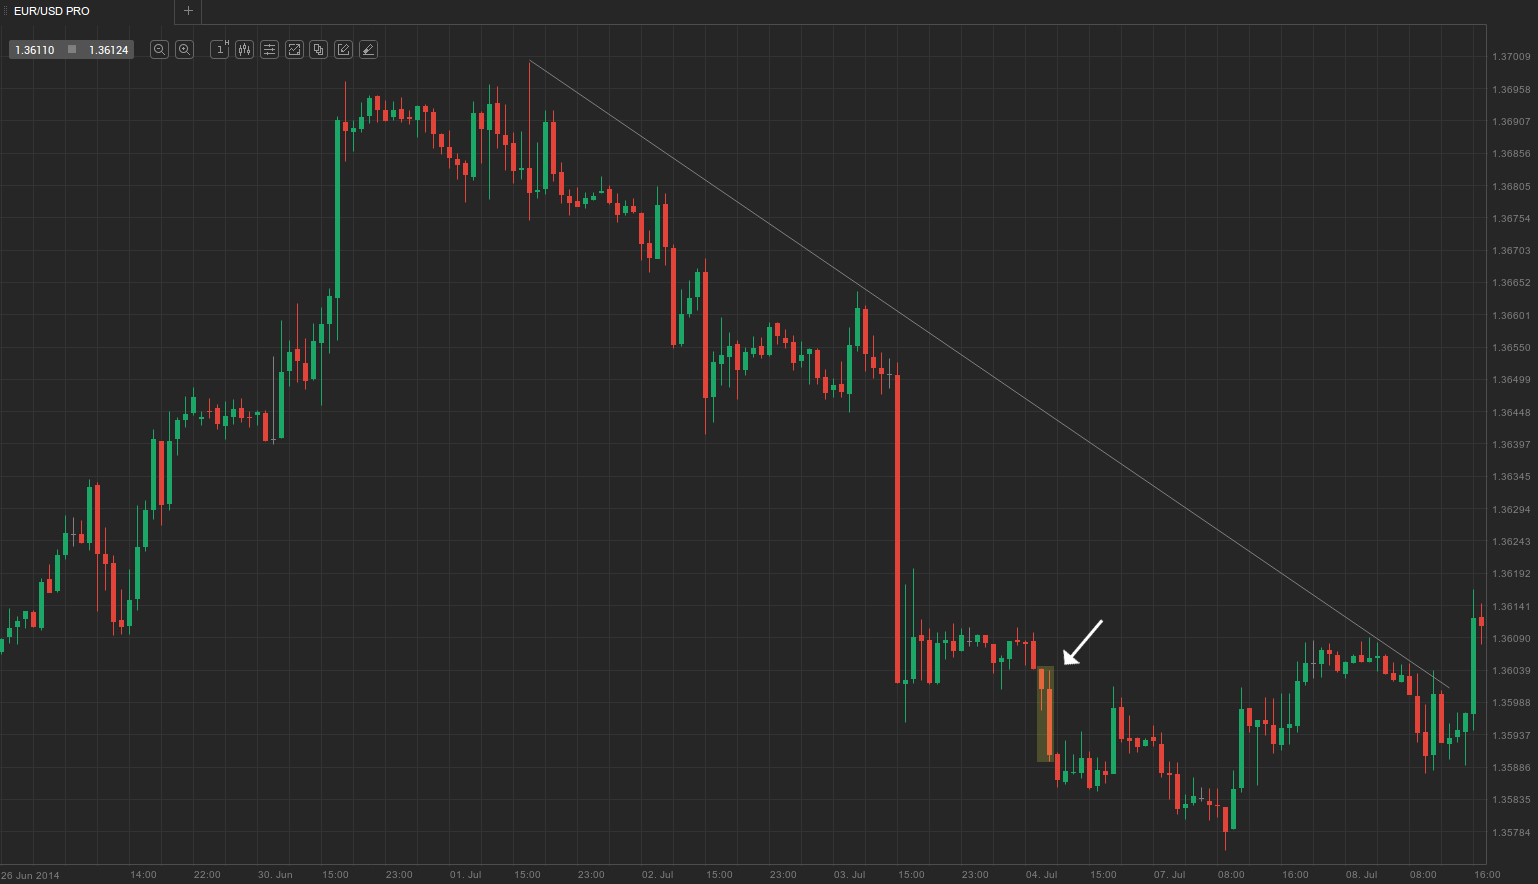
On the above screenshot you can see a EUR/USD hourly chart, which clearly shows that the market was in a strong bear trend during the period observed (coloured in yellow).
We then switch back to the 15-minute chart to determine support and resistance levels more accurately, as well as our entry point, stop-loss and profit target. It is visualised below.
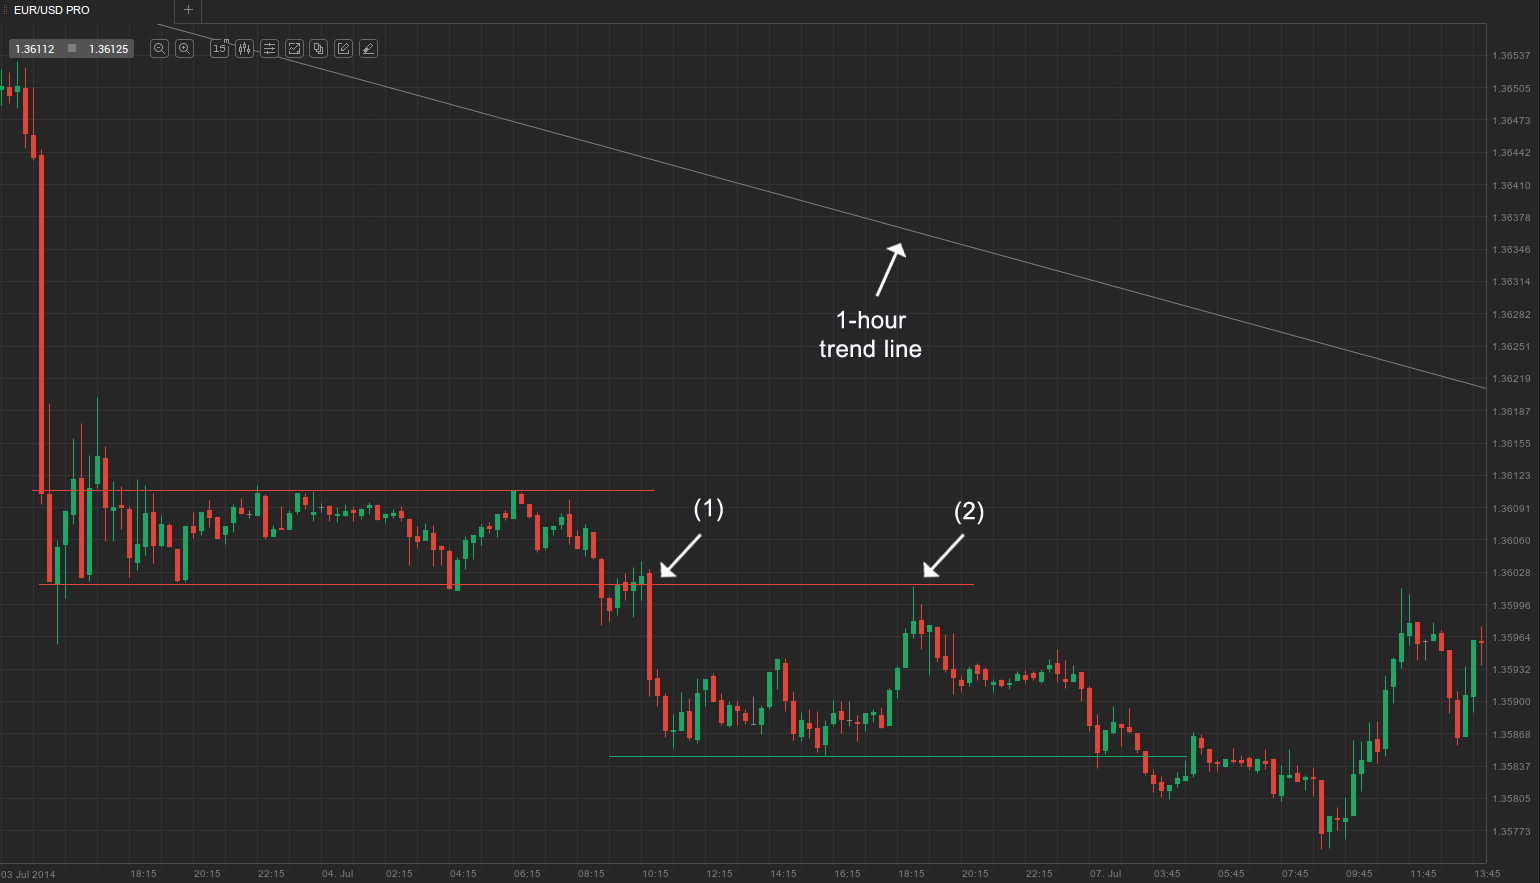
After a major sell-off during the previous day’s US session, the market entered a tight trading range that extended through the Asian trading hours. As the European session began, the market gapped down at (1) and penetrated the major support area of 1.3600. This set the stage for a possible short entry (in line with the general trend) if the gap were to be filled later. And so it did at (2).
As soon as the price retraced back to the support area, we wanted to see whether it would switch roles and act as resistance, as it did. Next, we waited for the formation of a definitive reversal bar on which we could base our entry. Bar 3 was the first bearish bar, reversing the previous four bullish trend bars, and so it seemed like a sufficiently good entry point; we therefore went short below its low. Alternatively, we could have waited for a stronger bearish trend bar as reversal confirmation, and the top-shaved bar 4 acted as such. Our profit target is the gap’s swing low, as marked by the green horizontal line, while our stop-loss must be placed above a recent major resistance area (15-20 pips above the 1.3600 area). Later, our profit target was reached, rendering the trade successful.