Forex trading strategy based on analysing multiple time frames
You will learn about the following concepts
- Indicators used with this strategy
- Signals to look for
- Entry point
- Stop-loss
- Profit target
When trading, it is possible to receive signals from different indicators that appear to contradict one another. If such an uncertain situation occurs, the best solution is to look at the bigger picture. Therefore, a trader should use a higher time frame. If he or she intends to trade on the 1-hour time frame, then:
First, he or she should examine the higher time frame (a daily chart, for instance) to detect the prevailing trend for the instrument (a currency pair, a commodity or an index). The trader can draw a trend line using three swing points, apply the Average Directional Index (ADX) to determine whether there is a trend, and examine moving averages with different periods to see whether they form a proper sequence. Sometimes the trend will be visible without any technical indicators or trend lines. If the instrument is in a bullish trend, only long positions are appropriate; if it is in a bearish trend, the trader should take only short entries. If there is no discernible trend, the trader should abstain from using this method;
- Trade Forex
- Trade Crypto
- Trade Stocks
- Regulation: NFA
- Leverage: Day Margin
- Min Deposit: $100
Second, having identified the direction in which he or she wants to trade on the higher time frame, the trader switches to a lower time frame chart to set the entry, exit and protective stop. If the trader has identified a bullish trend on the 1-day chart, he or she can make a long entry if the price drops to a support level on the 1-hour chart. A long position can also be taken if the Relative Strength Index (RSI), for instance, shows that the trading instrument is oversold on the 1-hour chart. Having entered long, the trader should place a protective stop below the support level or zone. If a bearish trend has been identified on the 1-day chart, a short position can be taken at a resistance level or if the RSI indicates that the trading instrument is overbought on the 1-hour chart.
On the daily chart of AUD/USD below, we first identified a bearish trend.
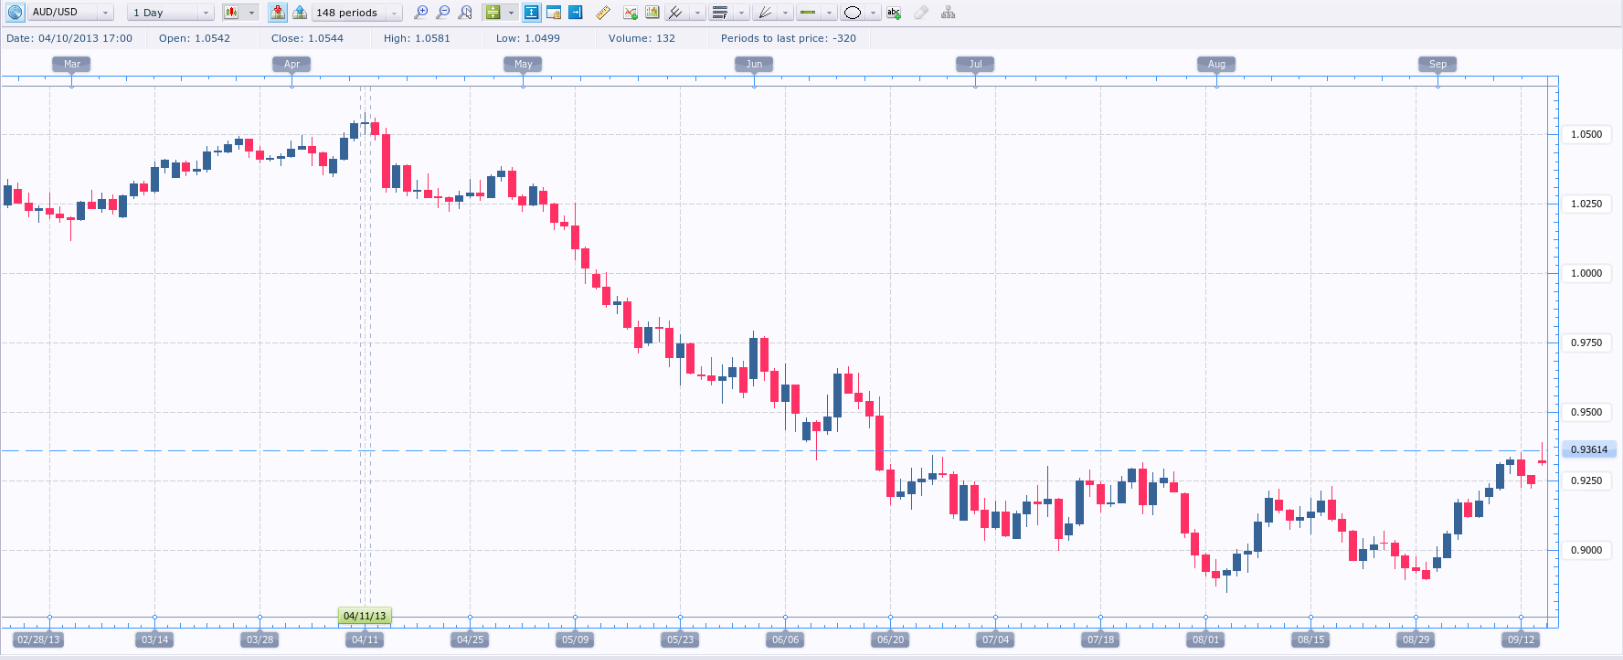
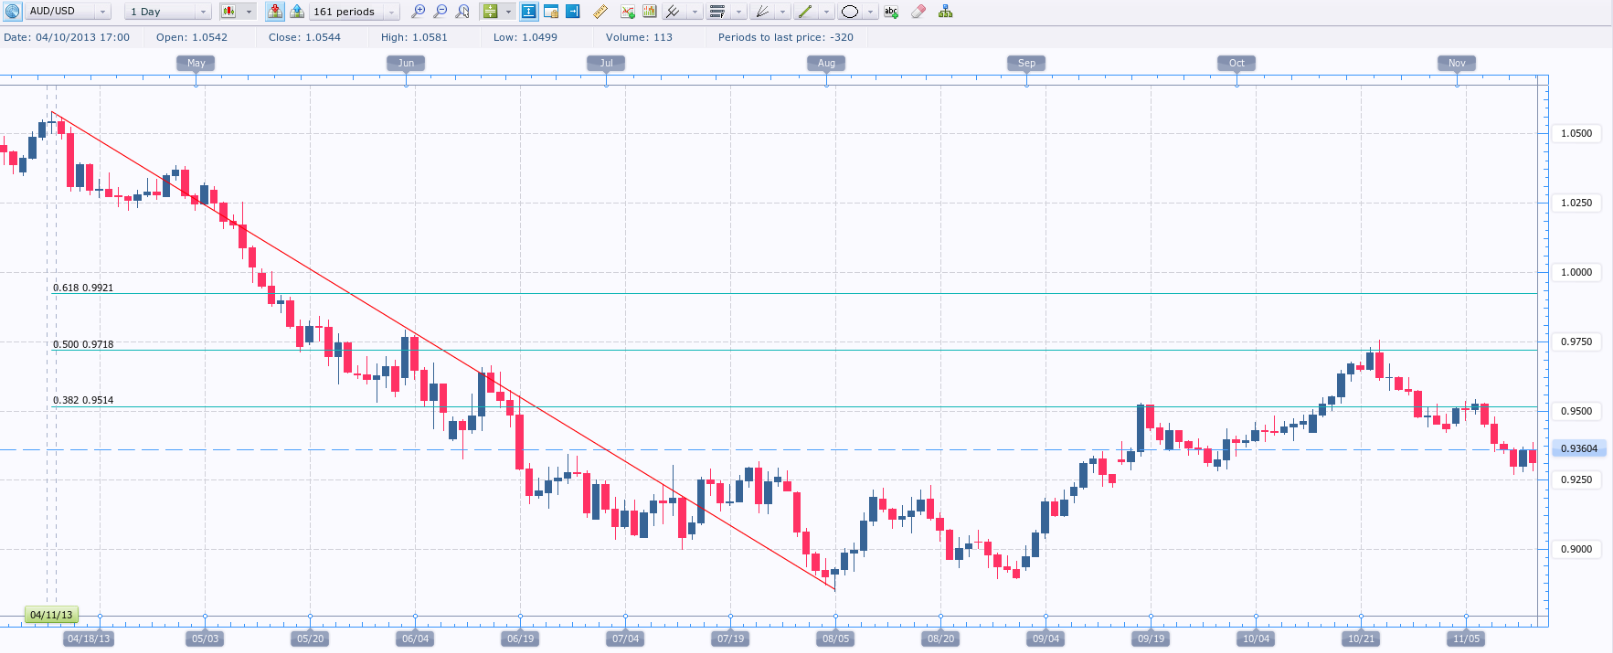
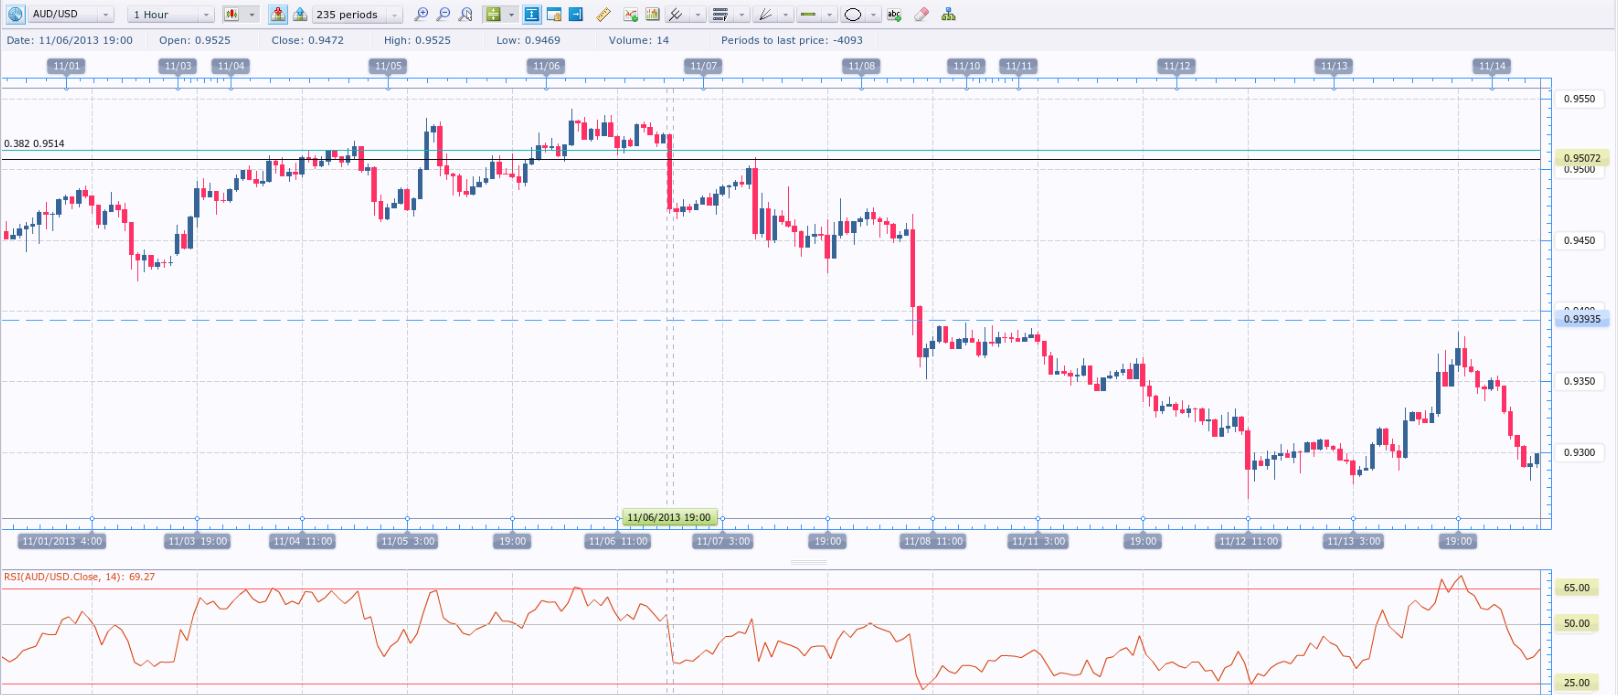
If a major trend shows signs of slowing, the trader should use Fibonacci retracement levels to identify where the trend is likely to resume. In our case, we need to look for a level of resistance where we will make our entry. We intend to take a short position so that, once the trend reasserts itself, we are positioned in line with it. We place the Fibonacci retracement from the high on 11 April down to the low on 5 August. As shown on the chart below, the 38.2% retracement of the recent bearish trend is a potential entry point. Moreover, this retracement level coincides with the area around 0.9514, which acted as resistance on 18 and 19 September.
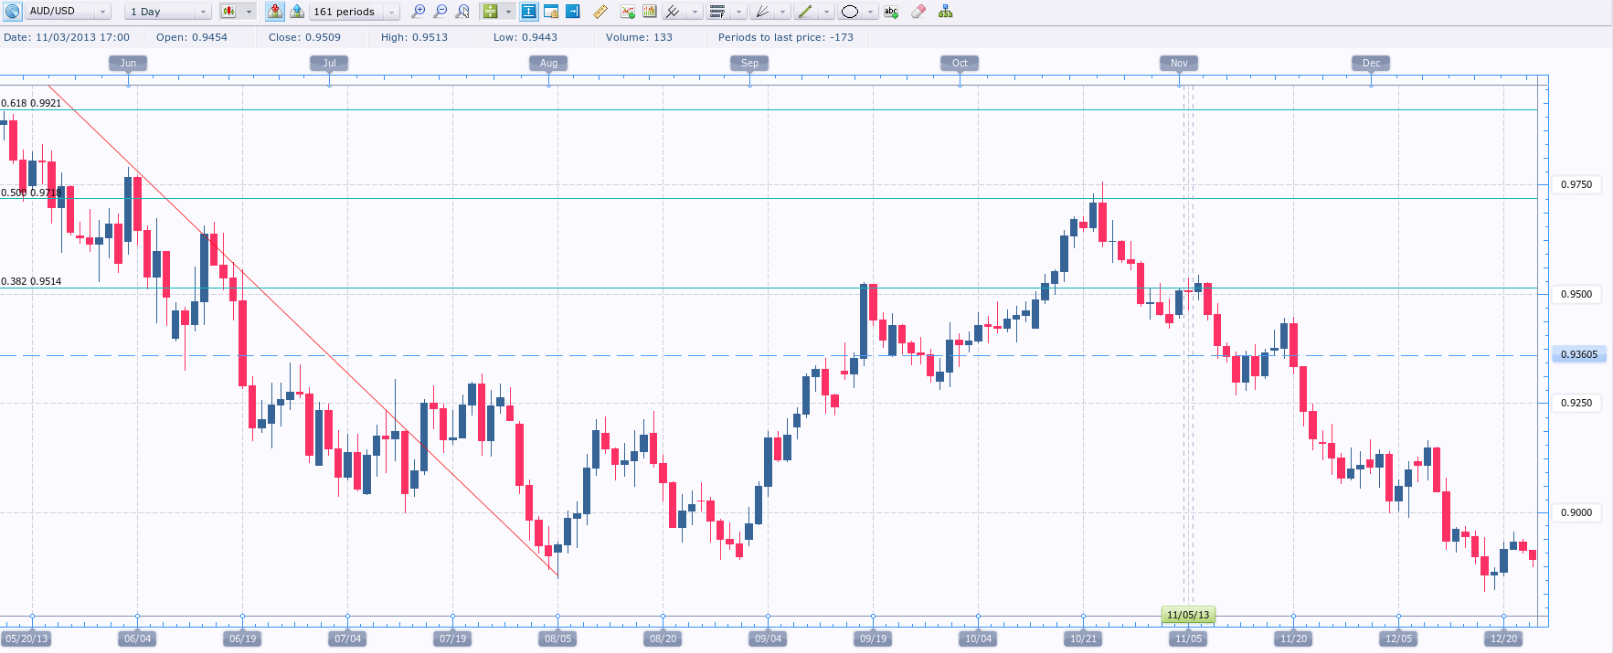
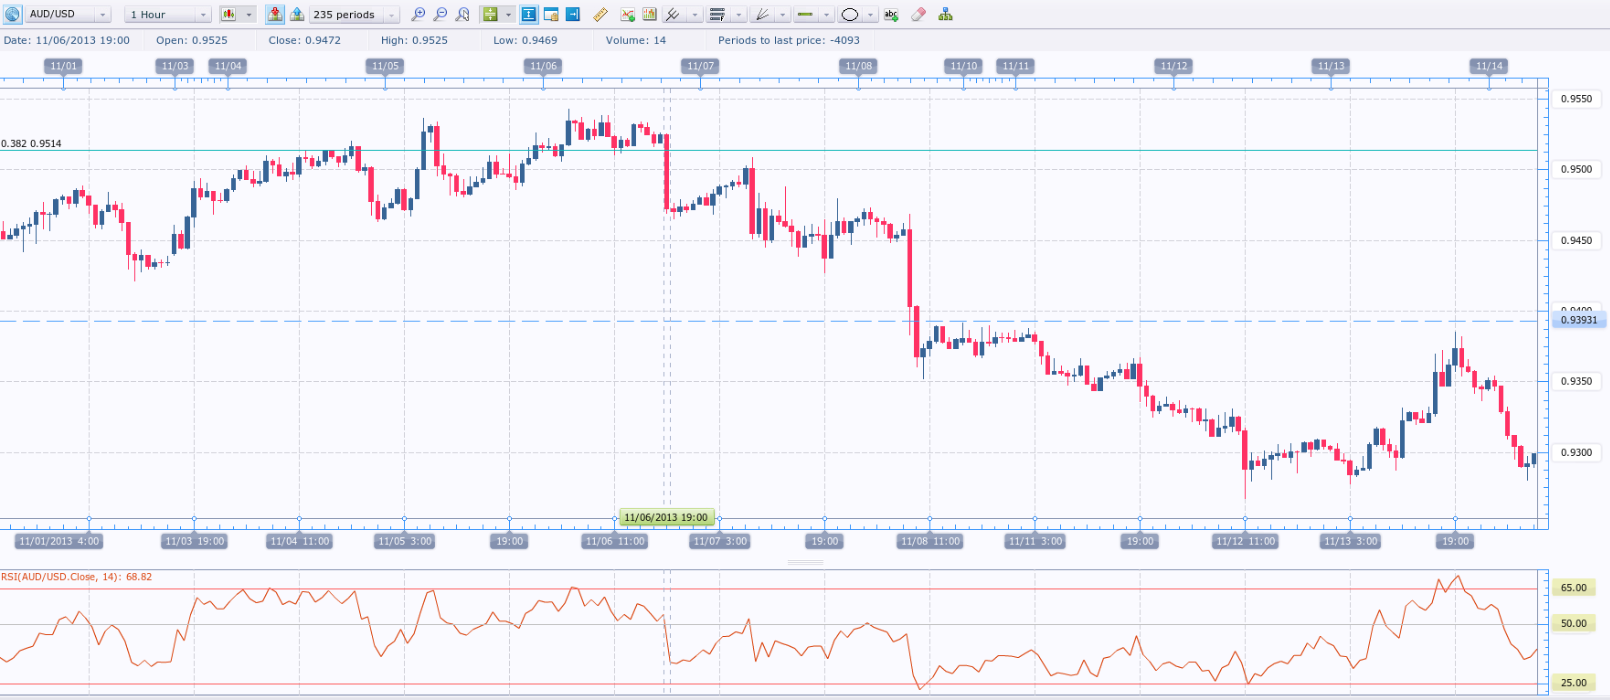
On 5 November, AUD/USD reached the 38.2% retracement and traded at resistance. But does that mean we should enter short immediately? Before entering, we switch to the 1-hour chart and examine the Relative Strength Index to see whether it is in the overbought zone. The RSI approached the overbought level and, on 6 November, breached it before falling back below.
Some traders will go short simply because the currency pair has become overbought. However, is this enough to assume the pair will not continue to rise? A currency pair or other trading instrument can still climb after a strong rally or fall further after a sharp drop. Traders must be aware that anything is possible once they have entered the market! There is a way to improve the chance of success – use an oscillator. In our case, the trader needs to wait for the oscillator to drop below the overbought level into neutral territory. This signals a shift in momentum and a possible counter-move.
However, waiting for the oscillator to change direction before entering means the trader will not enter at the absolute high. Many traders are willing to go short at the absolute high and go long at the absolute low, but this approach is perilous because no one can forecast the exact peaks and troughs of any trading instrument with precision. Waiting for momentum to shift therefore means forfeiting the opportunity to enter at the precise high or low.
The entry, the stop-loss and the profit target
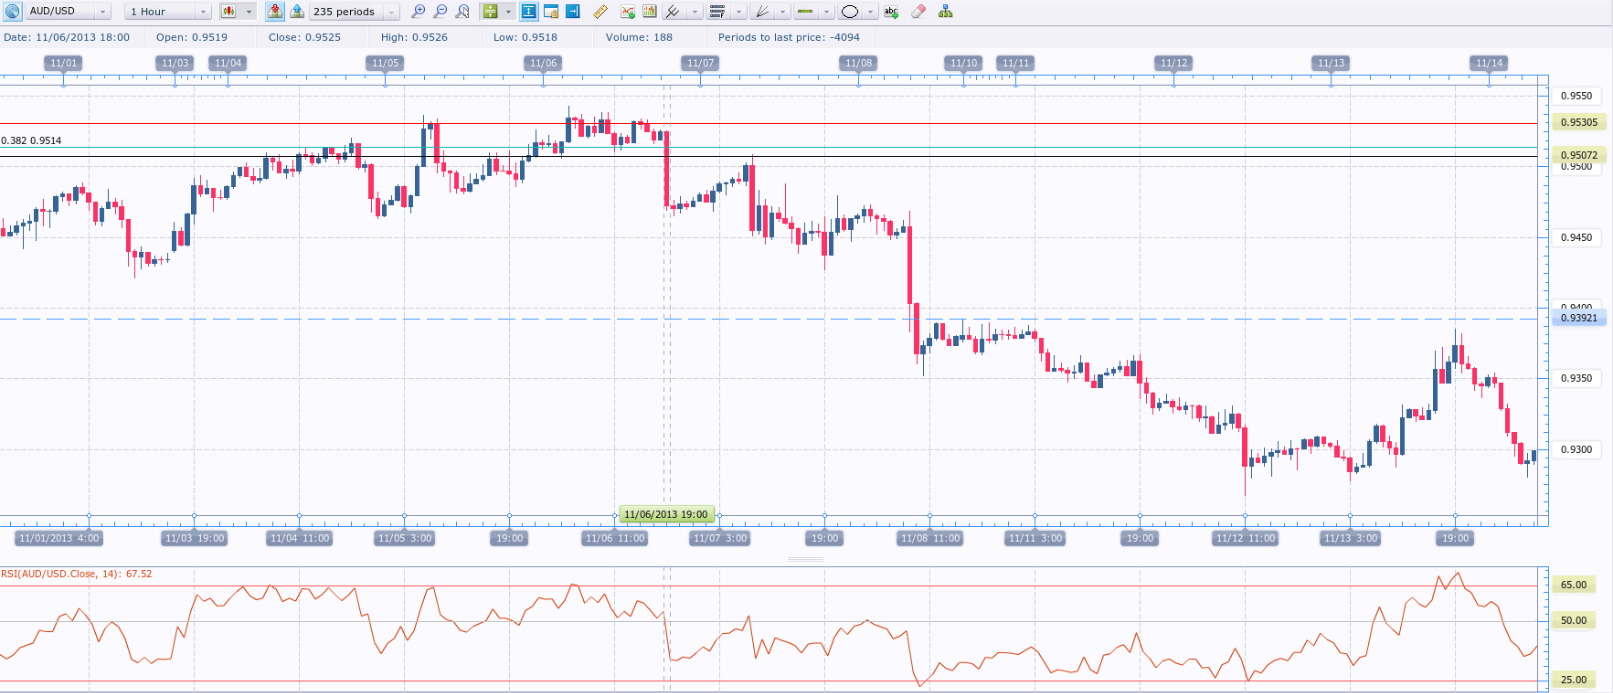
Let us go back to our example. As AUD/USD begins to fall and the RSI drops below the overbought level, we look to make our short entry. This takes place at 0.9507 (black line on the chart below), a level at which the RSI no longer indicates that the pair is overbought.
Next, we must place a protective stop immediately to safeguard our position against unexpected movement in the opposite direction. First, we may choose to place the stop above the recent high of 0.9542. Imagine a scenario in which AUD/USD continues to rally after we have already entered short. We certainly would not be willing to hold the position if the currency pair climbs to a new higher high. If it does trade above 0.9542, it could simply be breaking out to the upside. Second, the 38.2% Fibonacci retracement is at 0.9514, which is a resistance level. We therefore want our stop placed above this level. Third, if we prefer a tighter stop, we can place it in the area between the recent high and the 38.2% Fibonacci retracement. We choose to place it at 0.9530 (red line on the chart below).
In this way, the entry at 0.9507 and the stop-loss at 0.9530 create a risk of 23 pips. The final step is to identify the exit points. If we have two lots, we will close 50% of the trade at each exit. We identify the first exit by measuring the risk of our trade (23 pips per lot). If the currency pair moves in our favour by the number of pips risked, we can close a portion of the trade. The pair therefore needs to fall to 0.9484 to give us a 23-pip profit. Our first exit will be at 0.9484 (light green line on the chart below).
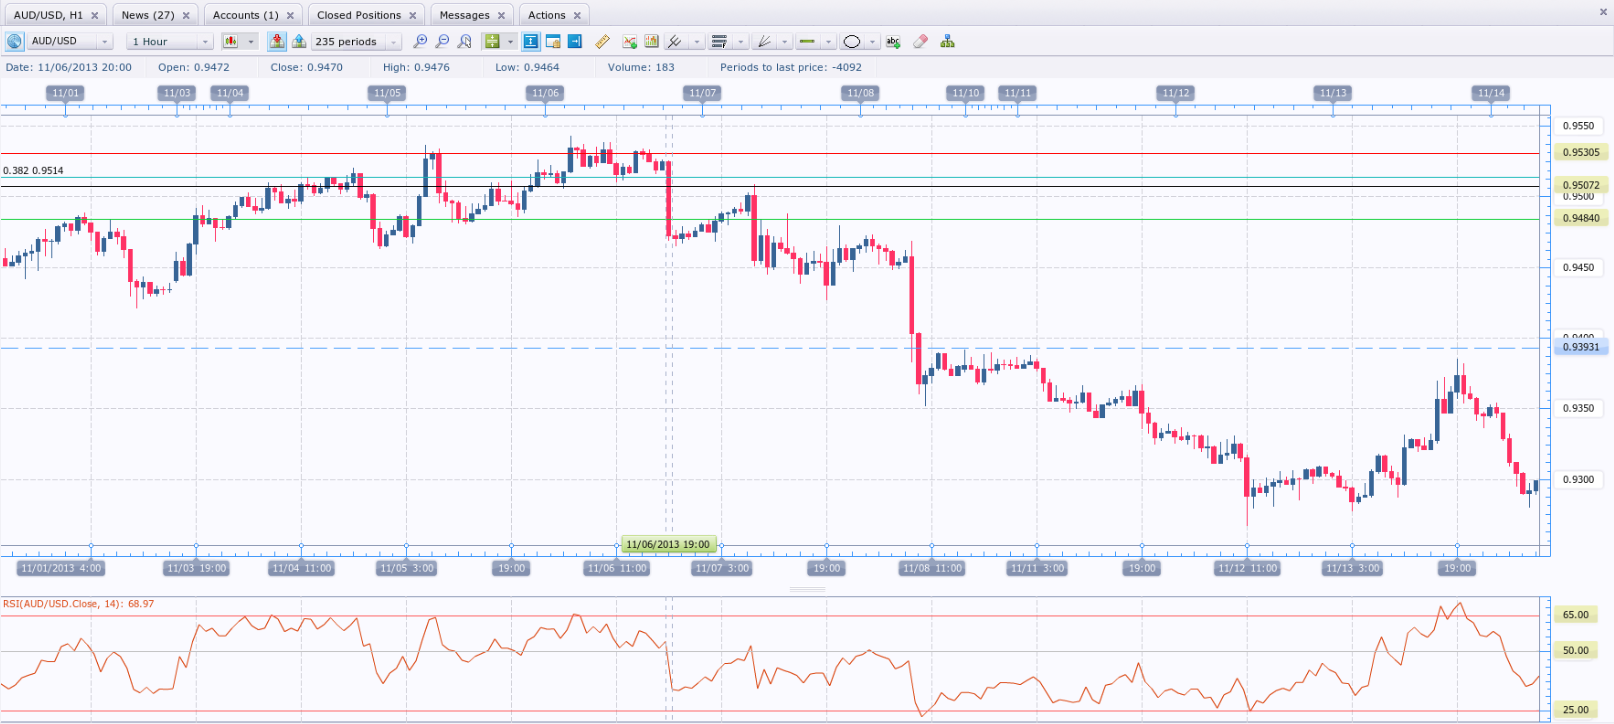
The second and final exit will be identified by looking for areas of prior support. If we look to the left of the chart, we notice that the currency pair previously found support around 0.9430. We therefore decide to use 0.9430 (dark green line on the chart below) as our second and final exit. Our total profit on this trade is 23 pips plus 77 pips, i.e., 100 pips using two lots (an average profit of 50 pips per lot).
