 Yesterday’s trade saw USD/JPY within the range of 119.38-120.67. The pair closed at 120.44, up 0.17% on a daily basis, or the most modest daily gain since September 10th, when it appreciated 0.08%. The daily low has been the lowest level since September 8th, when the cross registered a low of 118.83.
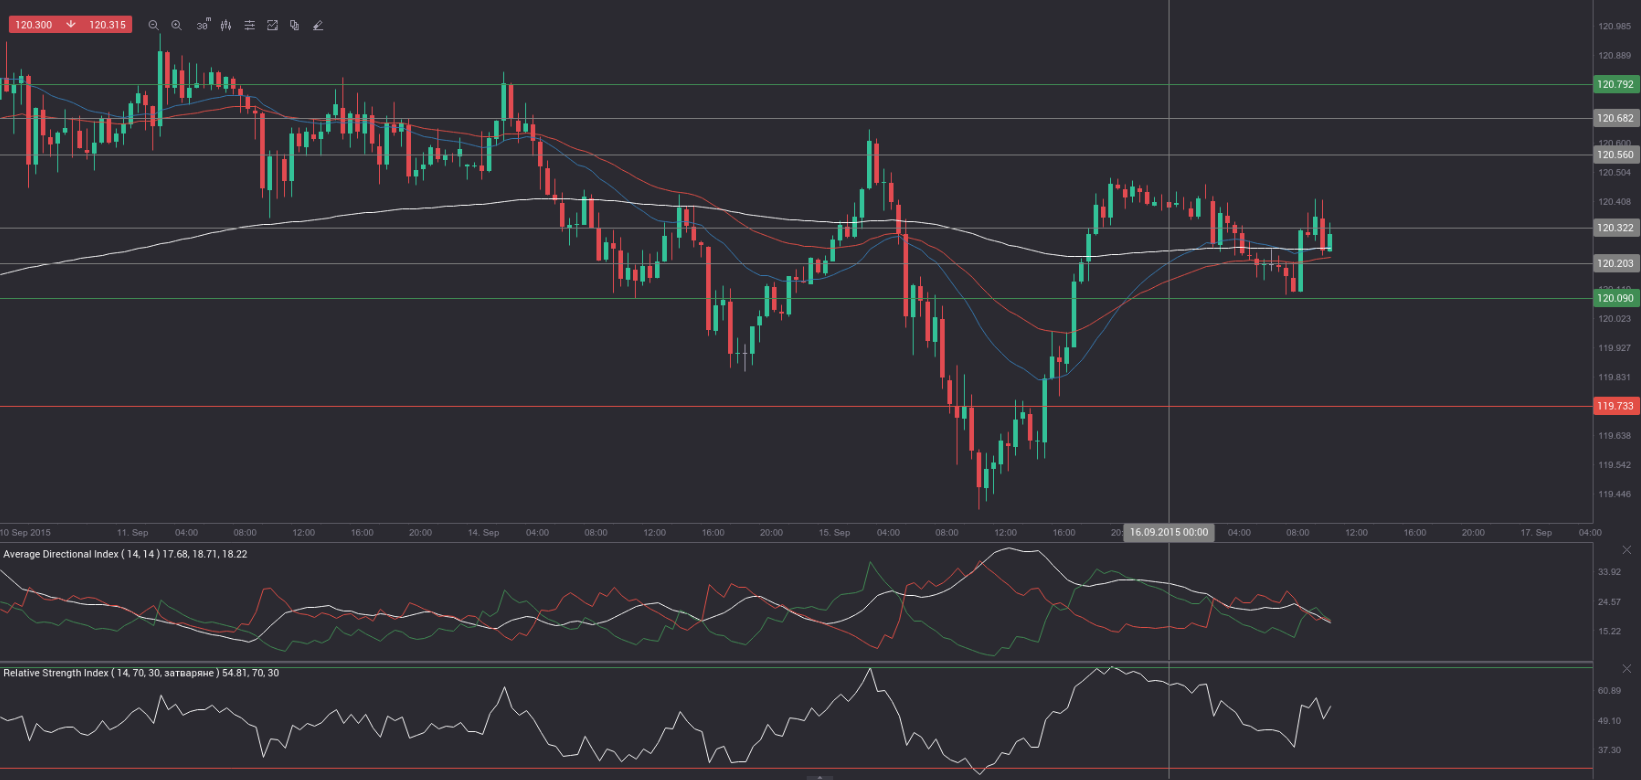
At 8:15 GMT today USD/JPY was losing 0.08% for the day to trade at 120.32. The pair tested the range support level (S3), as it touched a daily low at 120.11 at 5:20 GMT.
Today the cross may be influenced by a number of macroeconomic reports as listed below.
Fundamentals
United States
Consumer inflation
The annualized consumer inflation in the United States probably remained steady at 0.2% in August, according to market expectations. It has been the highest annual rate since December 2014, when inflation was reported at 0.8%. In June consumer prices rose 0.1% year-on-year, supported by higher costs of shelter. In monthly terms, the Consumer Price Index (CPI) probably showed a flat performance in August, following six consecutive monthly increases. In July the CPI went up at a monthly rate of 0.1%.
In July the largest upward pressure came from prices of services less energy (up 2.6% year-on-year, following a 2.5% increase in the prior month). Within this category, shelter cost rose 3.1% in July, following a 3.0% increase in June, while cost of medical care was up at an annual 2.3%, or the same rate as a month ago. In addition, cost of transportation services went up 2.1% in July, following a 1.7% surge in June. Prices of food rose 1.6% in July, following a 1.8% surge in June, while cost of energy slumped 14.8% year-on-year in July, after a 15% drop in the prior month, according to the report by the Bureau of Labor Statistics.
The CPI is based on a basket of goods and services bought and used by consumers on a daily basis. In the United States the Bureau of Labor Statistics (BLS) surveys the prices of 80 000 consumer items in order to calculate the index. The latter reflects prices of commonly purchased items by primarily urban households, which represent about 87% of the US population. The Bureau processes price data from 23 000 retail and service businesses.
The CPI includes sales taxes, but excludes income taxes, costs of investments such as stocks and bonds and sales prices of homes.
The annualized core consumer inflation, which is stripped of prices of food and energy, probably continued to accelerate in August, reaching a level of 1.9%, according to the median forecast by experts, up from 1.8% in July. If so, this would be the highest annual core inflation since July 2014, when a rate of 1.9% was registered. It is usually reported as a seasonally adjusted figure, because consumer patterns are widely fluctuating in dependence on the time of the year. The Core CPI is a key measure, because this is the gauge, which the Federal Reserve Bank takes into account in order to adjust its monetary policy. The Fed uses the core CPI, because prices of food, oil and gas are highly volatile, while the central bank’s tools are slow-acting. In case, for example, prices of oil plunge considerably, this could result in a low rate of inflation, but the central bank will not take action until this decrease affects prices of other goods and services.
If the CPI tends to approach the inflation objective, set by the Federal Reserve and considered as providing price stability, or a level below but close to 2%, this will usually bolster the appeal of the US dollar.
The Bureau of Labor Statistics is to release the official CPI report at 12:30 GMT. The data will add to the array of key indicators, which the Federal Reserve will take into account before announcing its policy decision tomorrow.
NAHB Housing Market Index
The National Association of Home Builders (NAHB) Housing Market Index probably remained stable in September at a reading of 61.0, according to market expectations. If so, this would be the 14th consecutive month, when the gauge stood in the area above 50.0, and also the highest level since November 2005. The indicator is based on a monthly survey in regard to current home sales and expected sales in the coming six months. Values above the key level of 50.0 indicate that housing market conditions are good. Therefore, higher-than-projected readings would provide support to the US dollar. The official data is scheduled for release at 14:00 GMT.
Japan
Merchandise balance of trade
The gap on Japanese merchandise trade balance probably expanded to JPY 541.3 billion during August, according to the median forecast by experts, from a deficit of JPY 268.1 billion, registered in July. If so, this would be the fifth consecutive month of deficit, but, what is more, it would be the largest figure since January, when a trade gap of JPY 1,177.5 billion was reported.
Total exports rose at an annualized rate of 7.6% year-on-year to reach JPY 6,663.77 billion in July. Within the category, shipments to the United States rose the most (+18.8% year-on-year), while exports to Asia, which account for more than half of the countrys total exports, went up 6.1% year-on-year. Shipments to China increased 4.2%, sales to Hong Kong went up 2.6%, those to Taiwan rose 10.5%, to South Korea (+3.1%), to India (+32.3%), to Vietnam (+22.8%), while exports to Singapore were down 2.7%.
At the same time, total imports dropped 3.2% year-on-year to JPY 6,931.82 billion in July. Inbound shipments were lower for raw materials (-10.4%) and mineral fuels (-28.9%). On the other hand, imports rose for foodstuffs (+1.7%), chemicals (+19.6%), manufactured goods (+1.2%), machinery (+9.6%) and transport equipment (+7.8%), according to Japans Ministry of Finance.
During the period 1970-2010 Japan has had regular annual trade surpluses. Since 2011, on the other hand, the country has been recording trade deficits, because yen depreciation led to higher costs of imports, while increased purchases of fossil fuels and gas were aimed to neutralize the loss of nuclear power after the devastating earthquake and the tsunami in March 2011.
In case the trade balance produced a larger-than-expected deficit, this would have a moderate bearish effect on the yen, due to negative implications regarding the nations GDP. The official trade data will be released at 23:50 GMT.
Bond Yield Spread
The yield on Japanese 2-year government bonds went as high as 0.023% on September 15th, or the highest level since September 8th (0.025%), after which it slid to 0.016% at the close to add 0.001 percentage point on a daily basis.
The yield on US 2-year government bonds climbed as high as 0.815% on September 15th, or the highest level in more than three months, after which it fell to 0.802% at the close to add 7.2 basis points (0.072 percentage point) for the day, while marking a second consecutive trading day of increase.
The spread between 2-year US and 2-year Japanese bond yields, which reflects the flow of funds in a short term, widened to 0.786% on September 15th from 0.715% during the prior day. The September 15th yield difference has been the most notable one in more than three months.
Meanwhile, the yield on Japans 10-year government bonds soared as high as 0.384% on September 15th, or the highest level since September 4th (0.396%), after which it slid to 0.363% at the close to appreciate 1.2 basis points (0.012 percentage point) compared to September 14th. It has been the first gain in the past three trading days.
The yield on US 10-year government bonds climbed as high as 2.294% on September 15th, or the highest level since July 30th (2.322%), after which it slipped to 2.276% at the close to add 9.3 basis points (0.093 percentage point) on a daily basis.
The spread between 10-year US and 10-year Japanese bond yields widened to 1.913% on September 15th from 1.836% during the prior day. The September 15th yield difference has been the largest one since July 14th, when the spread was 1.936%.
Daily and Weekly Pivot Levels
By employing the Camarilla calculation method, the daily pivot levels for USD/JPY are presented as follows:
R1 – 120.56
R2 – 120.68
R3 (range resistance – green on the 30-minute chart) – 120.79
R4 (range breakout – red on the 30-minute chart) – 121.15
S1 – 120.32
S2 – 120.20
S3 (range support – green on the 30-minute chart) – 120.09
S4 (range breakout – red on the 30-minute chart) – 119.73
By using the traditional method of calculation, the weekly pivot levels for USD/JPY are presented as follows:
Central Pivot Point – 120.19
R1 – 121.74
R2 – 122.89
R3 – 124.44
S1 – 119.04
S2 – 117.49
S3 – 116.34